
|
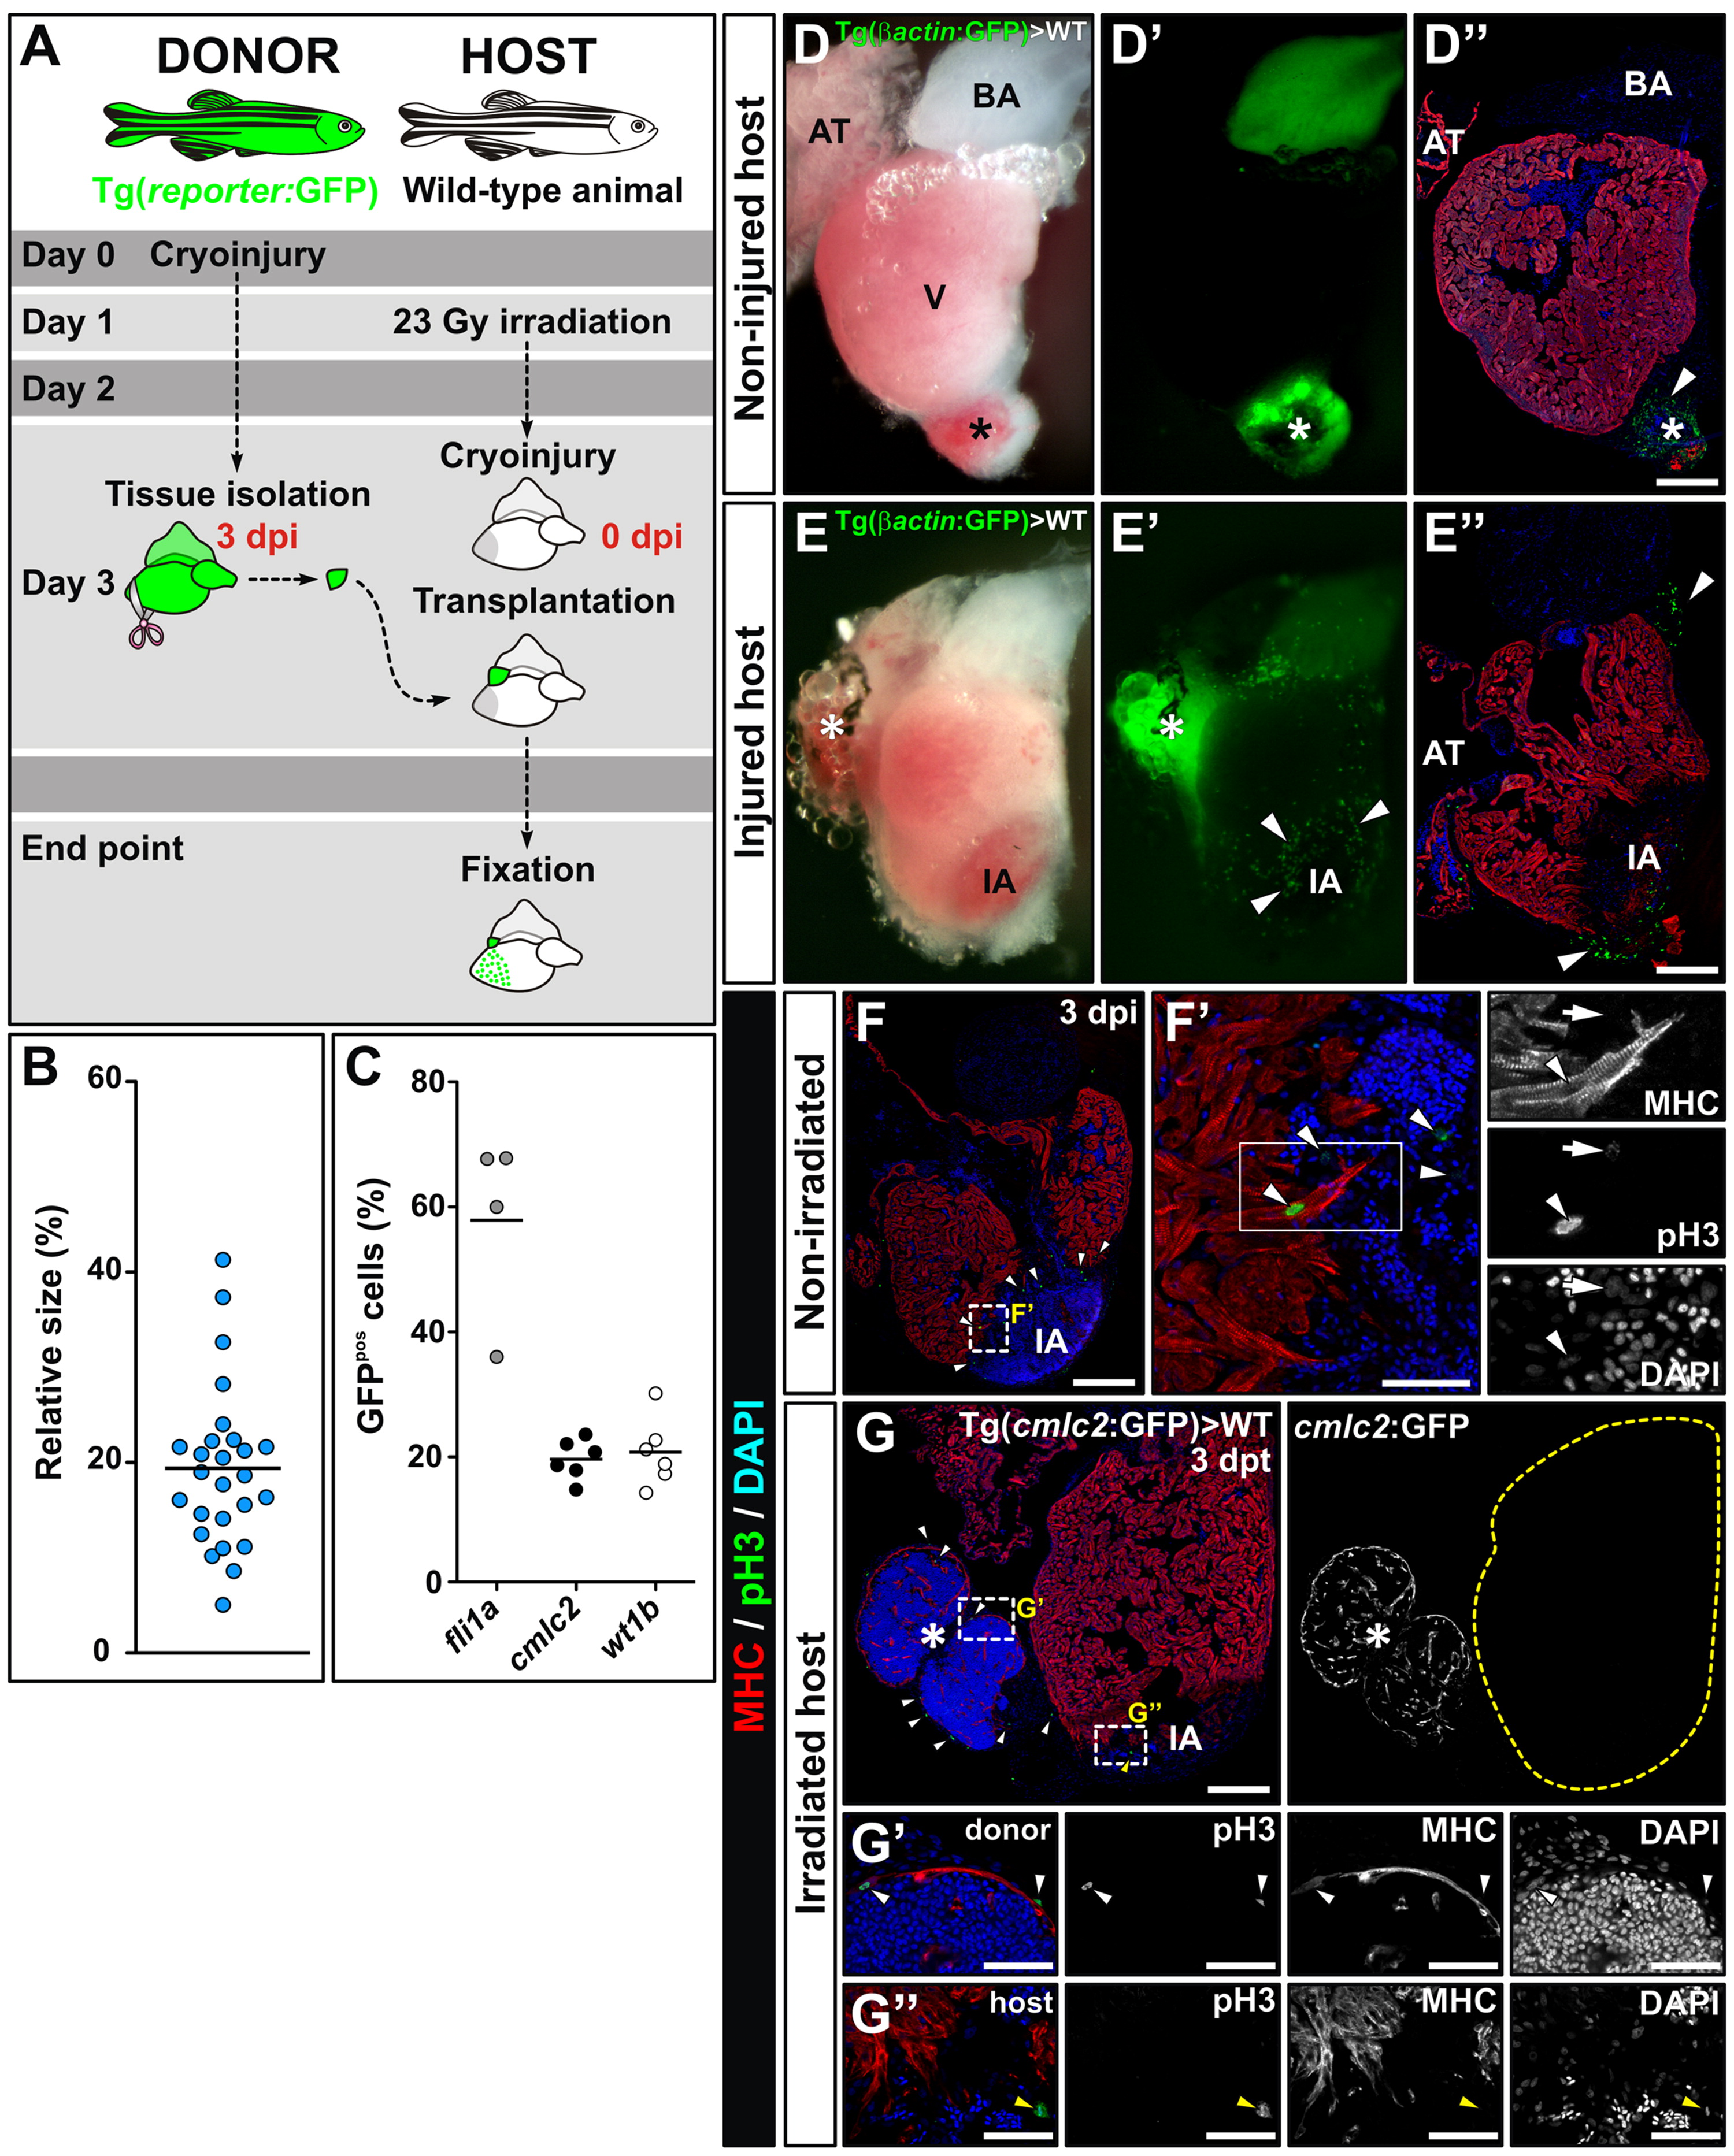
Fig. 3 Cardiac tissue transplantation method for the study of cellular contribution during zebrafish heart regeneration. (A) Experimental scheme. Donor hearts from a transgenic reporter fish line were cryoinjured and dissected at 3 dpi. Cardiac tissue explants containing epicardium were transplanted into freshly-cryoinjured hearts of irradiated wild type fish. Host hearts were fixed at different stages and the contribution of grafted cells to the regenerated tissue analysed. (B) Quantification of the size of the grafted tissue. The plot shows the size of 26 grafts at 3 days posttransplantation (dpt), each graft being represented by a circle as the percentage relative to the host ventricle. The horizontal bar indicates the mean % of the graft size. (C) Cell composition of grafts. The percentage of cells expressing endothelial/endocardial, myocardial and epicardial markers within each graft was estimated by FACS of cells from 4 to 6 donors before transplantation. Horizontal bars indicate the mean % of cells. (D-E′) Bright field and fluorescence images of hearts at 4 dpt. (D-D′′) Transplantation of a Tg(β-actin:GFP) graft to an uninjured wildtype (WT) heart did not result in contribution of graft-derived cells to the host. (D) Bright field whole mount view. (D′) GFP fluorescence in the specimen in D: while grafted tissue (asterisk) is strongly GFP+, no GFP+ cells are found on the surface of the host heart (the signal in the bulbus arteriosus is autofluorescence). (D′′) Immunohistochemistry on sections, using antibodies to myosin heavy chain (MHC) to label myocardium (red) and GFP to label grafted cells (green) reveals green cells in the graft but not in the host heart. Cell nuclei are labelled with DAPI (blue). (E-E′′) After grafting Tg(β-actin:GFP) tissue to a cryoinjured heart, GFP+ cells attach to and spread over the surface of the host myocardium. Views are as in D-D′′. Immunohistochemistry on sections reveals β-actin:GFP cells inside the host heart. Arrowheads in D′′, E′ and E′′ mark GFP+ cells. (F-G′′) Effect of irradiation on cell proliferation. (F-F′) Immunohistochemistry on wildtype heart sections at 3 dpi, revealing phospho-histone H3 (pH3) staining in green, myosin heavy chain (MHC) in red and nuclear counterstain with DAPI (blue). F′ shows a zoomed view of the boxed area in F, and separate channels of the central area are shown to the right. Arrowheads mark numerous pH3+ cells close to the IA, and the white arrow marks a mitotic cell with punctuated pH3 staining (late G2). (G-G′′) Staining as in F on a cryoinjured heart from an irradiated wildtype fish grafted with tissue from the cryoinjured heart of Tg(cmcl2:GFP) donor fish at 3 dpt. The panels show a whole-mount view (G) and zoomed views of boxed areas (G′ and G′′). While the graft contains numerous pH3+ cells, including cardiomyocytes (G′), the irradiated host heart is almost devoid of pH3+ cells (G′′). pH3-positive cells from the graft are marked by white arrows; that in the irradiated host is marked by a yellow arrow. G′ and G′′ represent zoomed views of boxed regions in G showing merged and single channel views. Note the pH3-positive cardiomyocyte in G′. Asterisks mark the graft. Abbreviations as in previous figures. Bars, 200 μm (full views) and 50 μm (magnifications).
Reprinted from Developmental Biology, 370(2), Manuel González-Rosa, J., Peralta, M., and Mercader, N., Pan-epicardial lineage tracing reveals that epicardium derived cells give rise to myofibroblasts and perivascular cells during zebrafish heart regeneration, 173-186, Copyright (2012) with permission from Elsevier. Full text @ Dev. Biol.