
|
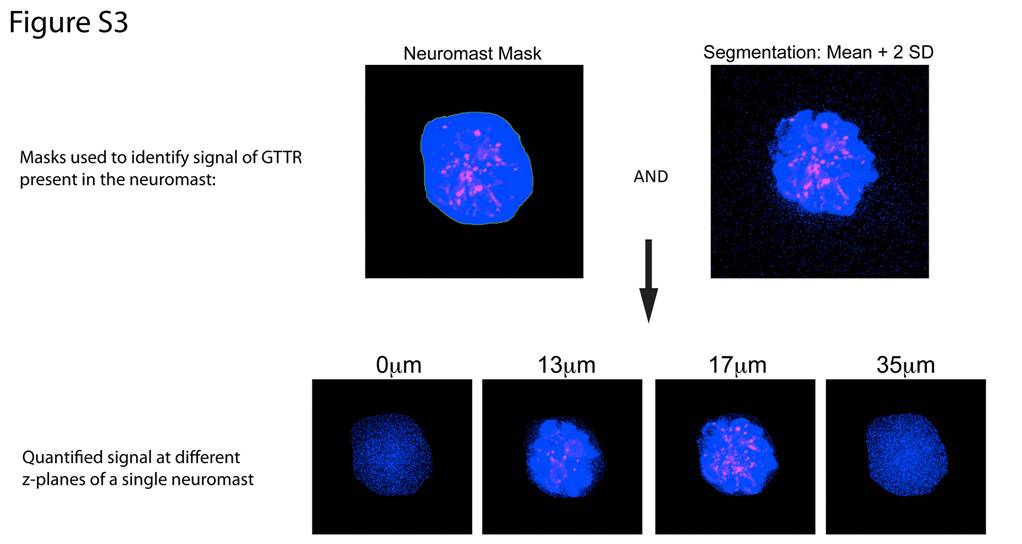
Fig. S3 Quantification of GTTR signal. To quantify GTTR signal, 3-D image stacks were collected of entire neuromasts at z-increments of 0.4 μm. Total fluorescence of neuromasts was calculated in individual neuromasts using 3i Slidebook Image Analysis software. A mask was drawn around visually identified neuromasts. The image on the top left shows a mask outlining a neuromast. Pixels within this mask are shown in blue; GTTR signal is red. A second identical mask was placed outside the neuromast to quantify background. Neuromast and background signals were segmented to discard points less than 2 standard deviations above the mean background value. The pixels that meet this criteria are shown in blue in the top right image. These two masks were then combined to generate a mask (the signal mask) that contained the region of the neuromast and required that values in that the mask be at least the mean value of the background plus two standard deviations. The bottom panels show this mask at different z-planes for the neuromast shown in the top panel. Blue points represent those points included in the mask. We calculated the mean intensity of the blue points in the signal mask. This mean value of the neuromast signal was then divided by the mean background signal to yield the relative intensity of the neuromast signal relative to background.