
|
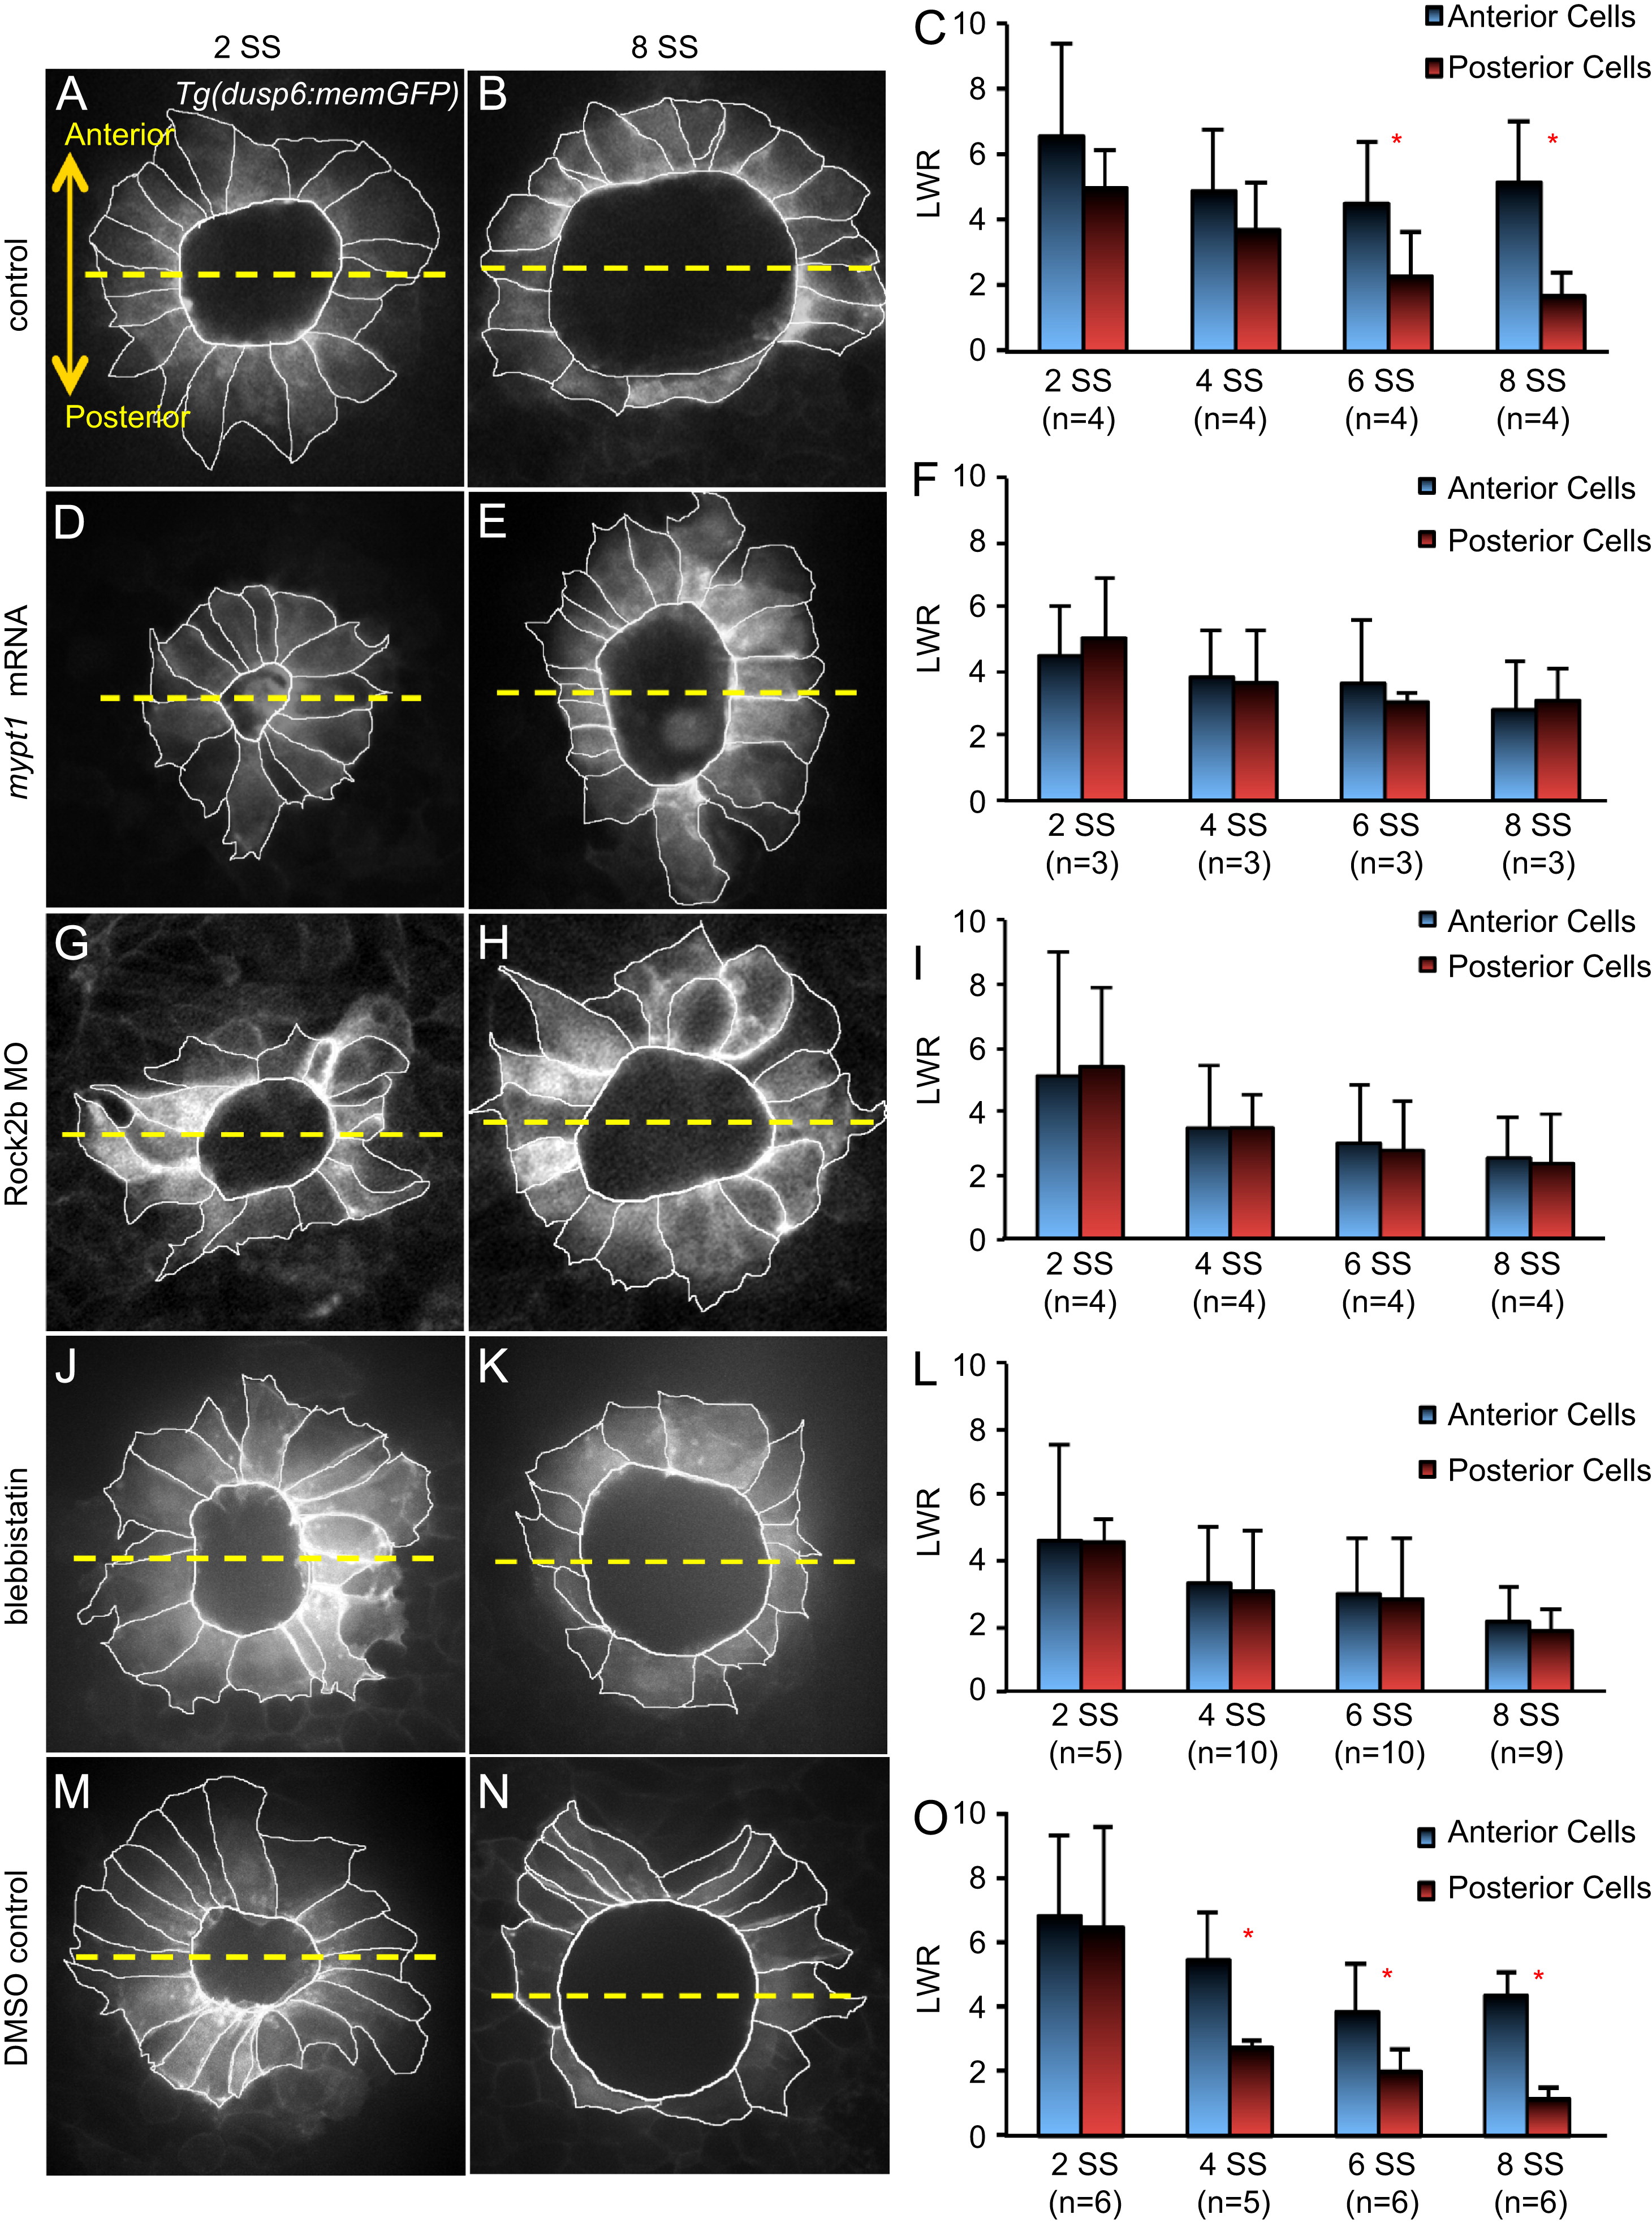
Fig. 4 Interfering with Myosin II Activity via Mypt1 over-expression, Rock2b knockdown or blebbistatin treatment disrupts KV cell shape changes. (A, B, D, E, G, H, J, K, M and N) Images of outlined KV cells in Tg(dusp6:memGFP) embryos at 2 SS (A, D, G, J, and M) or 8 SS (B, E, H, K and N) treated with control MO (A and B), mypt1 mRNA (D and E) Rock2b MO (G and H), blebbistatin (J and K) or DMSO (M and N). The dashed yellow line bisects KV into anterior and posterior regions. Images are oriented with anterior at the top and posterior at the bottom. (C, F, I, L and O) Average length-to-width ratios (LWR) of anterior and posterior cells at different stages of KV morphogenesis in treated embryos. Error bars=one standard deviation. n=number of embryos analyzed. * Significant difference between anterior and posterior (p<0.01).
Reprinted from Developmental Biology, 370(1), Wang, G., Manning, M.L., and Amack, J.D., Regional Cell Shape Changes Control Form and Function of Kupffer's Vesicle in the Zebrafish Embryo, 52-62, Copyright (2012) with permission from Elsevier. Full text @ Dev. Biol.