
Fig. 6
- ID
- ZDB-IMAGE-121026-15
- Publication
- Hsu et al., 2012 - Cdc42 GTPase and Rac1 GTPase act downstream of p120 catenin and require GTP exchange during gastrulation of zebrafish mesoderm
- All Figures
- Figures for Hsu et al., 2012
|
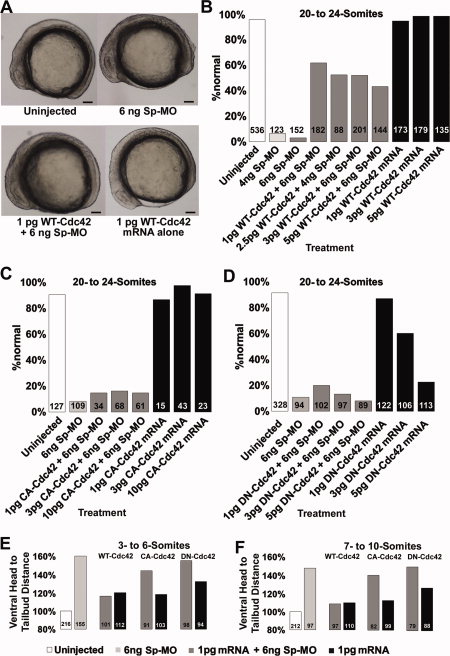
Fig. 6 WT-Cdc42 is downstream of p120 catenin δ1 during axis extension in zebrafish embryos. A: Representative 10-somite embryo side views, dorsal up, anterior left of embryos uninjected, injected with δ1 splice-MO (Sp-MO) and/or WT-Cdc42. Scale bars = 100 μm. B–D: A significantly greater portion of p120 catenin δ1 splice-MO-treated embryos recover their normal phenotype when co-injected with WT-Cdc42. Shown are the percentage of embryos restored to normal (uninjected) phenotypes by co-injection of Sp-MO with (B) WT-Cdc42 mRNA, (C) CA-Cdc42 mRNA, or (D) DN-Cdc42 mRNA. Also shown are the effects of injecting the mRNAs alone. E, F: The decrease in axis extension in 3- to 10-somite embryos as indicated by an increase in the head-to-tail distance. Distances are normalized to the uninjected embryos (clear bar), which were set at 100% for each different clutch of eggs. Embryos were injected at the 1-cell stage with 6 ng Sp-MO (light grey box). These baseline measurements are followed by measurements on embryos co-injected with 6 ng Sp-MO and 1 pg mRNA (grey boxes) or 1 pg mRNA alone (black boxes). The types of Cdc42 mRNAs injected and the stage of the embryos are indicated above the bars. The numbers of embryos observed are given on the graph bars.