
Fig. 5
- ID
- ZDB-IMAGE-121023-21
- Genes
- Publication
- Yang et al., 2012 - Neutrophils exert protection in the early tuberculous granuloma by oxidative killing of mycobacteria phagocytosed from infected macrophages
- All Figures
- Figures for Yang et al., 2012
|
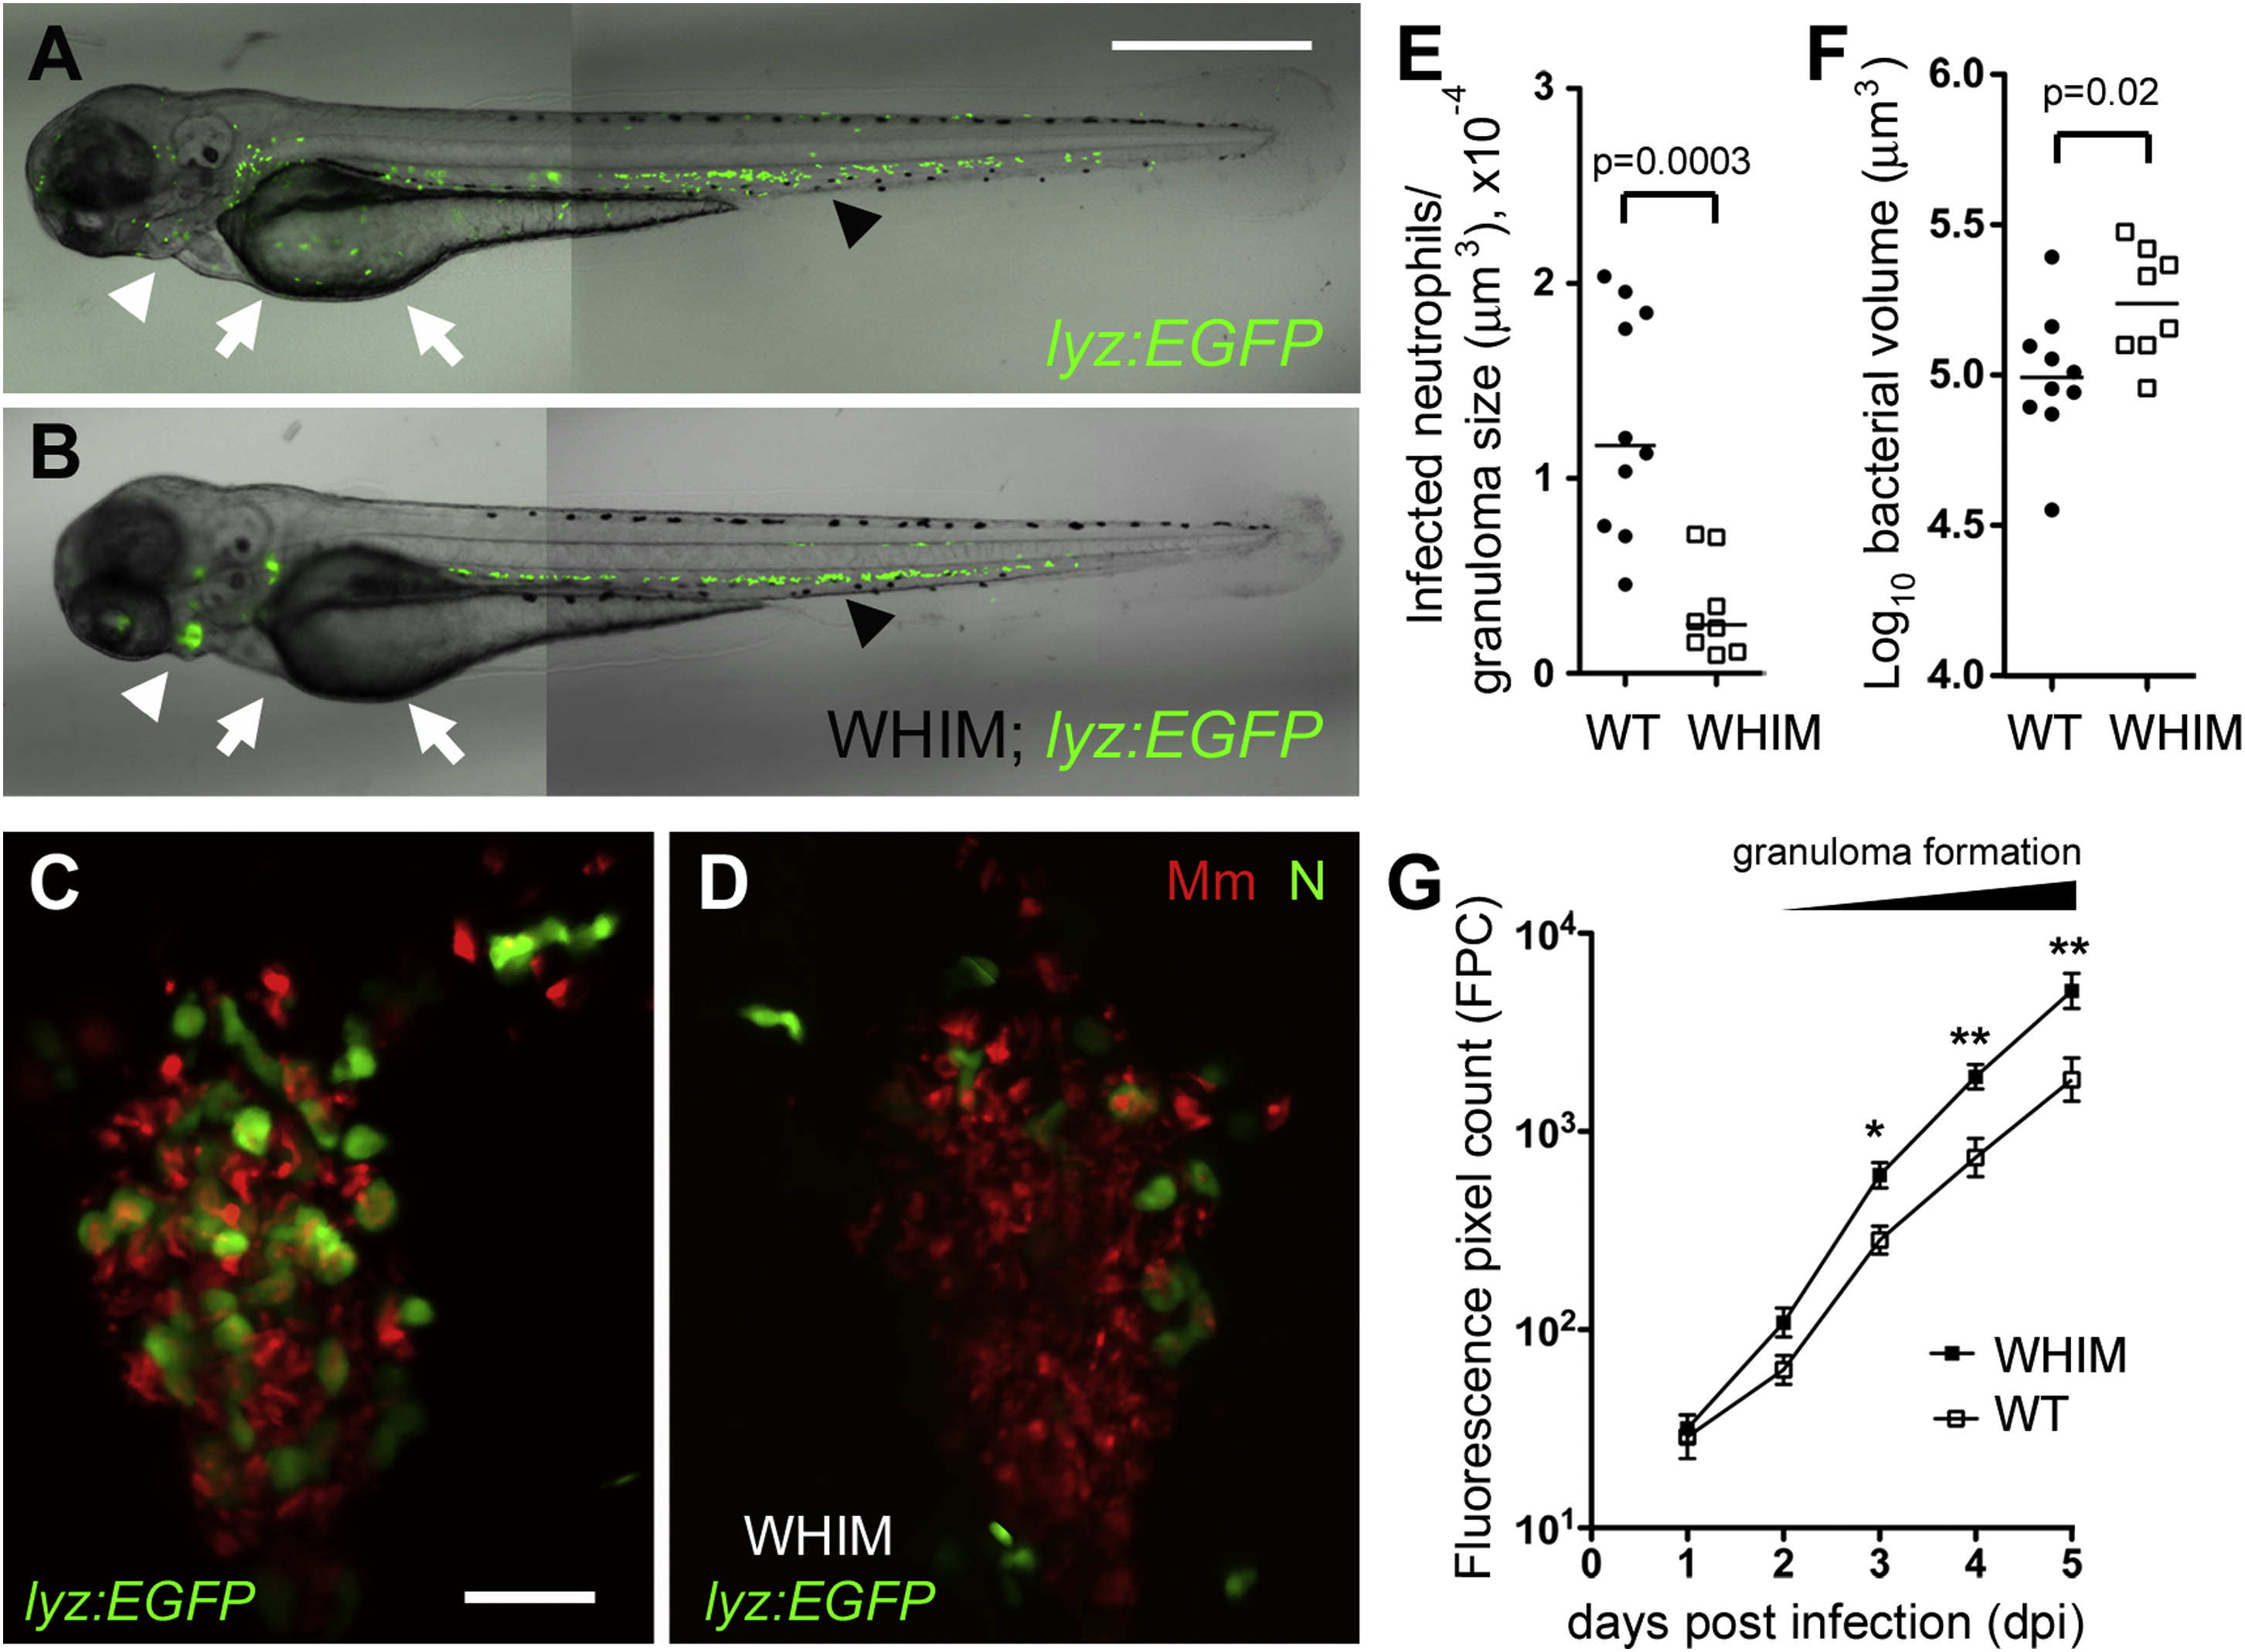
Fig. 5
Neutrophils Play a Protective Role upon Granuloma Formation (A and B) Fluorescence and DIC overlay of 3 dpf WT (A) and WHIM (B) zebrafish showing neutrophil distribution. Arrows, yolk; white arrowheads, pronephros; black arrowheads, CHT. Scale bar, 300 μm. (C and D) High-resolution laser confocal images of representative 3 dpi granulomas in WT (C) and WHIM (D) larvae. Green, neutrophil (N), red, Mm. Scale bar, 30 μm. (E) Median infected neutrophils per granuloma, normalized to granuloma size. Granulomas were from ten WT and seven WHIM larvae. p value by Mann-Whitney rank test. (F) Mean size of granulomas in (E). p values were determined by Student′s unpaired t test. (G) Serial bacterial burdens (mean ± SEM) of 2 dpf WT (n = 13) or WHIM (n = 10) fish infected by caudal vein with 189 Mm measured by fluorescent pixel count (FPC). Representative of three experiments. *p < 0.05; **p < 0.01 (one-way ANOVA with Bonferroni′s multiple comparison test; all other comparisons not significant). Also see Figure S3.