
Fig. S4
- ID
- ZDB-IMAGE-120907-19
- Publication
- Chiu et al., 2012 - Development and fibronectin signaling requirements of the zebrafish interrenal vessel
- All Figures
- Figures for Chiu et al., 2012
|
Fig. S4
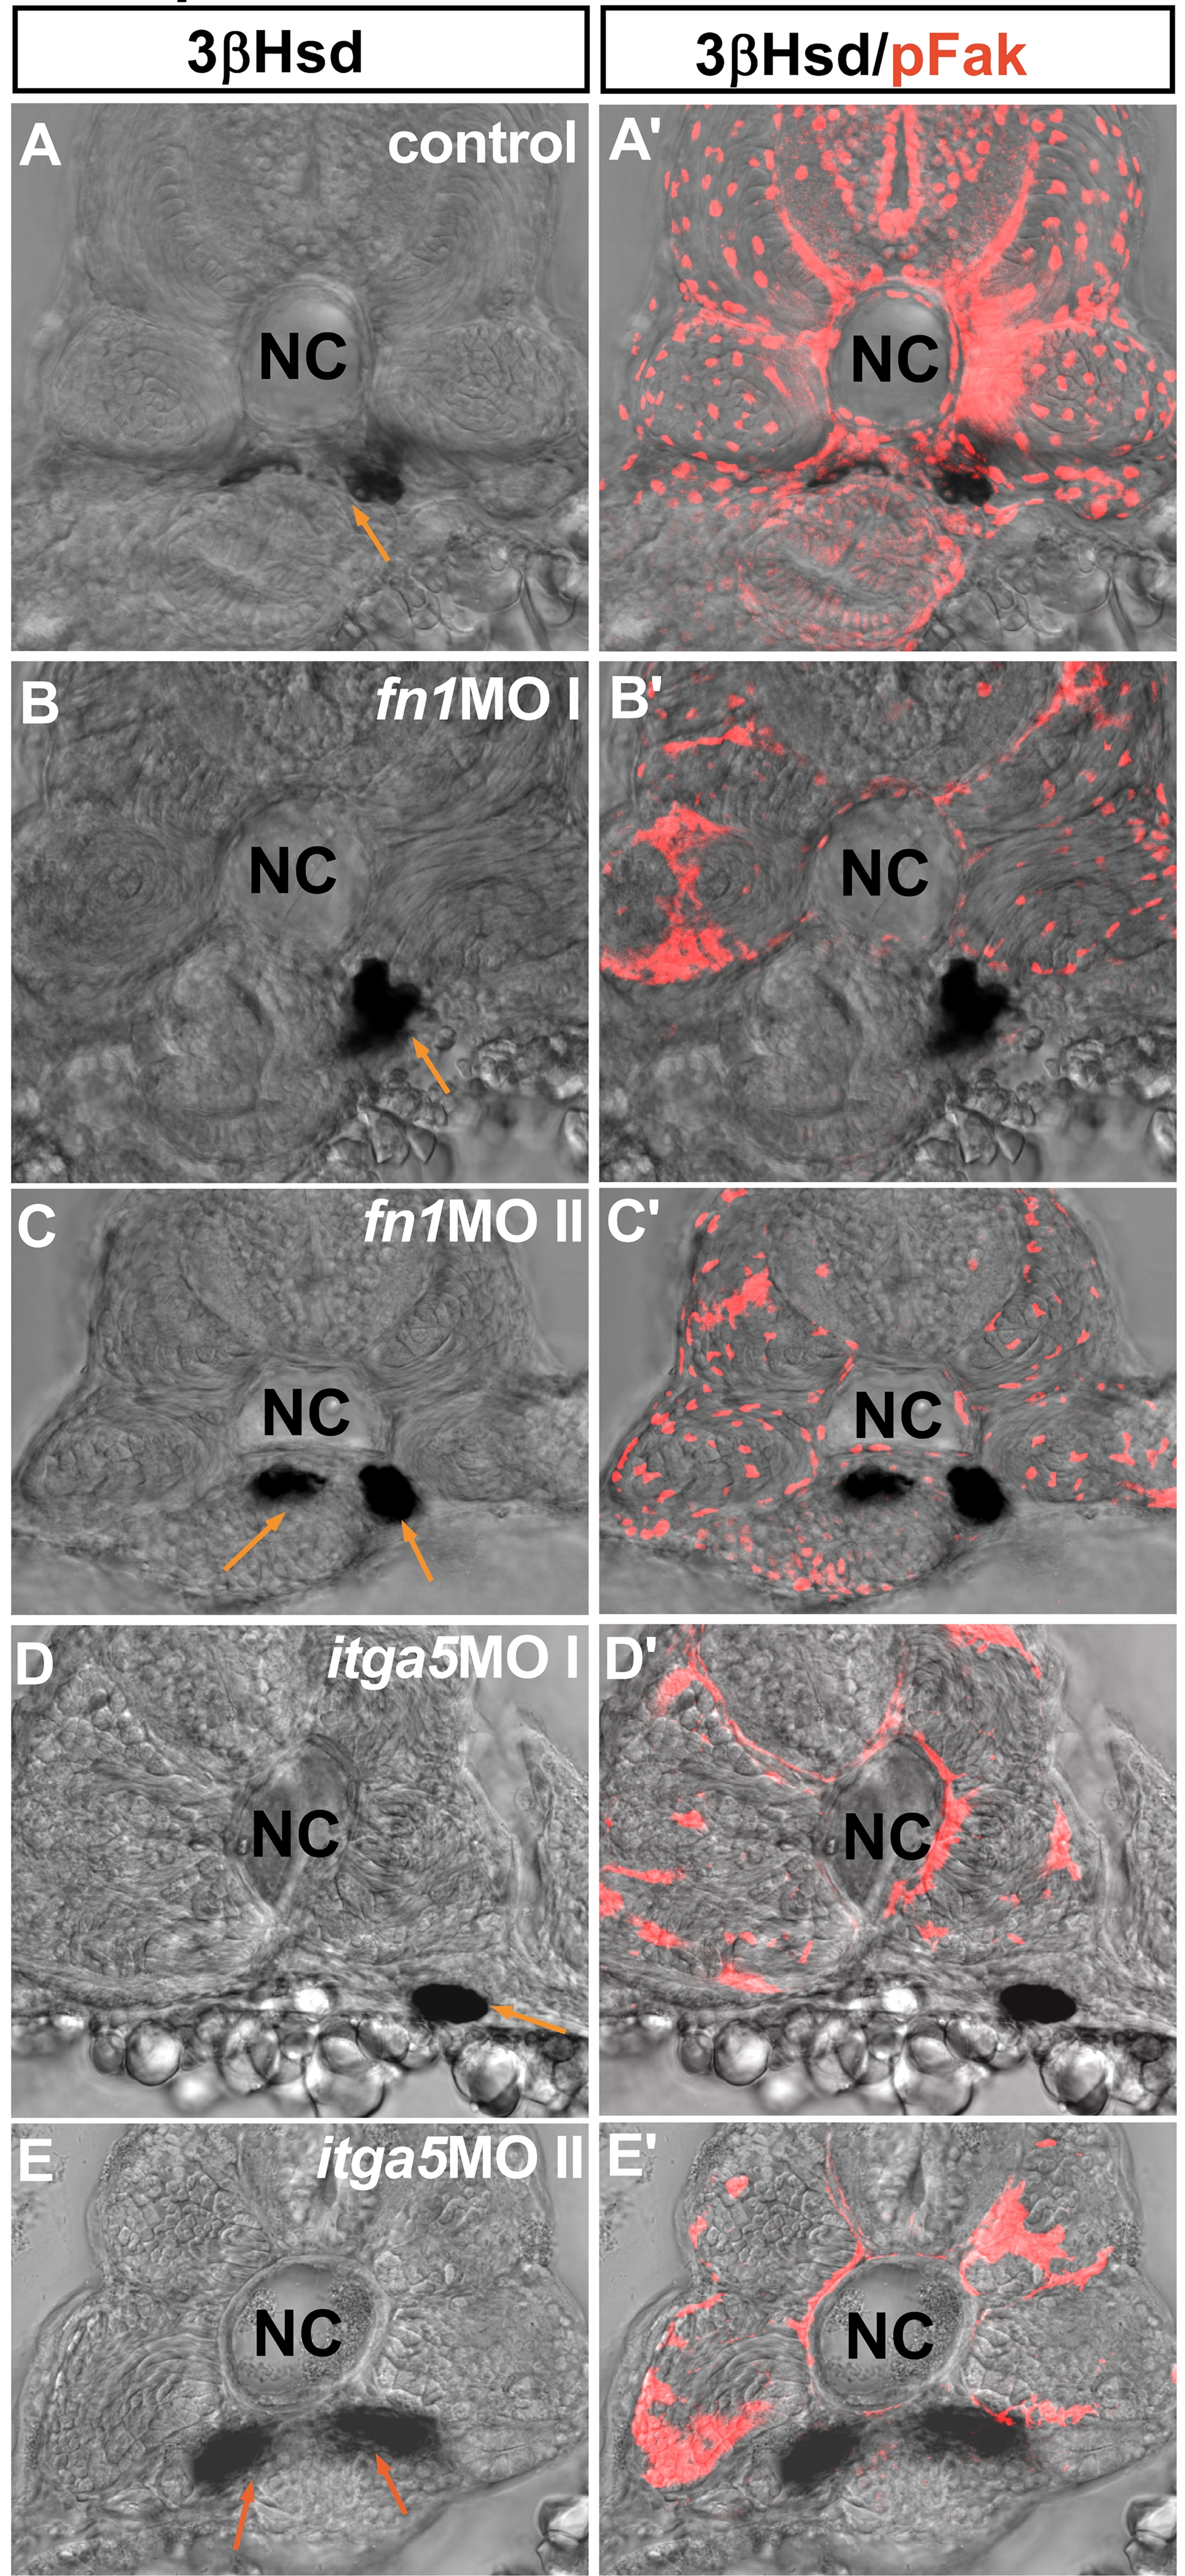
The distribution of pFAK in the interrenal and peri-interrenal regions of the fn1 and itga5 morphants as well as the wild-type control embryo at 2.5 dpf. Transverse sections of fn1 morphants (B, B′, C, C′) and itga5 morphants (D, D′, E, E′), as well as the wild type control embryo (A, A′), which were assayed for 3βHsd activity (black) and pFAK expression (red). All sections are oriented with the posterior end toward top of page. While pFAK could be readily detected in both interrenal and peri-interrenal regions of the wild-type embryo, its presence was disrupted in either fn1 or itga5 morphants. The 3βHsd-expressing interrenal tissues are indicated by organge arrows. Abbreviations: notochord (NC), swim bladder (SB).