
|
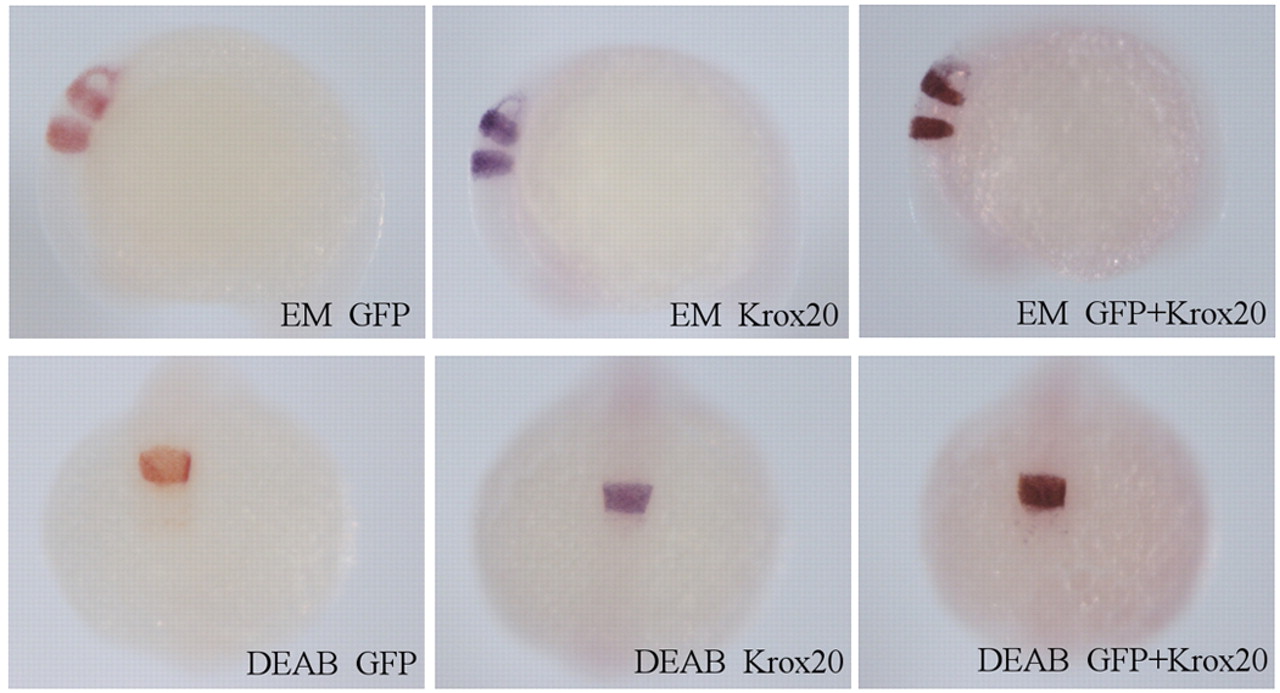
Fig. 3
Response of the GFP transgenic embryos to DEAB and RA treatments. gfp expression in r3 and r5 in transgenic zebrafish embryos incubated in EM or 10 μM DEAB (from sphere stage). (Top row) In situ hybridization of embryos grown in EM at the 12- to 14-somite stage for gfp (red), krox20 (a known marker of r3 and r5, blue) and both gfp and krox20. Side view. (Bottom row) In situ hybridization of embryos grown in DEAB for gfp, krox20 and both gfp and krox20. Dorsal view. gfp expression reproduces the response of krox20. Since gfp allows the monitoring of live embryos, we have used it to quantify their response to all-trans RA.