
Fig. 1
- ID
- ZDB-IMAGE-120831-21
- Publication
- Mu et al., 2012 - Visual Input Modulates Audiomotor Function via Hypothalamic Dopaminergic Neurons through a Cooperative Mechanism
- All Figures
- Figures for Mu et al., 2012
|
Fig. 1
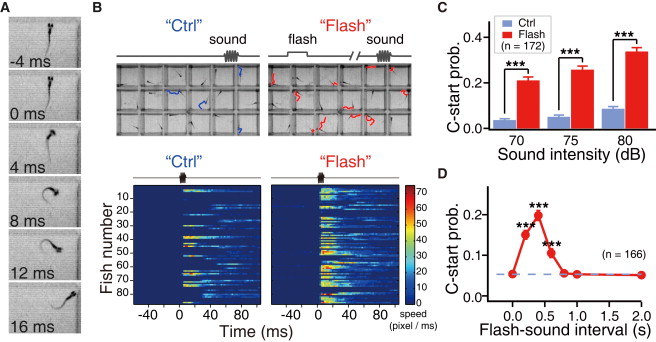
Preceding Visual Stimulus Enhances Sound-Evoked C-Start Behavior of Larval Zebrafish (A) Representative images showing a successful C-start escape behavior of a 5 dpf zebrafish larva in response to a sound stimulus (80 dB), which was applied at 0 ms. (B) Examples showing sound-evoked C-start behavior of same larvae under control condition (“Ctrl”) or when a preceding white flash (15 ms, 10 lux) was applied at 0.4 s before the sound onset (“Flash”). Sound stimulus: 500 Hz 10 ms pure tone at 80 dB. Top, a part of portraits of 96-well plate with one 5-dpf larva in each well. The blue and red traces represent the 60 ms trajectory (immediately after the sound onset) of the head in all larvae exhibiting C-start behavior in response to the sound. Bottom, heat map showing the time course of locomotion speed of all 87 larvae from the same 96-well plate under Ctrl (left) or Flash (right) condition. The locomotion speed is color-coded. (C) Summary of data showing that a preceding flash applied at 0.4 s before the sound onset increases the probability of C-start behavior evoked by sound stimuli at different intensities. Data were obtained from 172 larvae at age 5–6 dpf. (D) Time window showing that flashes applied 0.2–0.6 s before the sound (70 dB) are effective in enhancing auditory C-start behavior. The dashed line indicates the C-start probability under control condition. The data were obtained from 166 larvae aged at 5 dpf with each tested at each flash-sound interval. ***p < 0.001 (paired Student’s t test). Error bars represent SEM. See also Figure S1.