
Fig. S4
- ID
- ZDB-IMAGE-120816-3
- Publication
- Provost et al., 2012 - Ribosomal biogenesis genes play an essential and p53-independent role in zebrafish pancreas development
- All Figures
- Figures for Provost et al., 2012
|
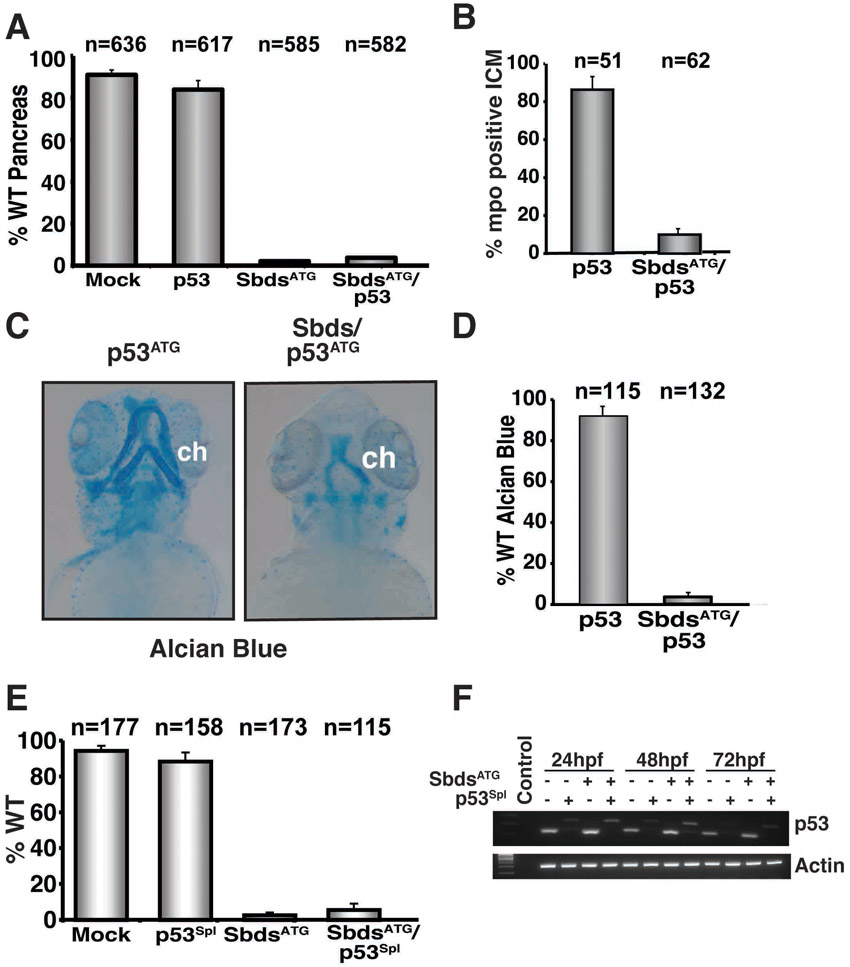
Fig. S4 Quantification of the SbdsATG morphant phenotype with concomitant knockdown of p53. (A) Quantification of multiple independent experiments scored for wild-type pancreatic development at 72 hpf in p53ATG MO-injected embryos. (B) Quantification of three independent experiments scored for mpo-positive cells in the intermediate cell mass (ICM) at 24 hpf. (C) Disrupted cartilage persists in p53ATG/SbdsATG MO-injected embryos at 72 hpf (blue). (D) Quantification of three independent experiments scored for percentage of embryos exhibiting wild-type ceratohyal development at 72 hpf. (E) Quantification of three independent experiments scored for the fraction of embryos with wild-type pancreas in SbdsATG and p53Spl MO-injected ptf1a:eGFP;ins:mCherry embryos at 72 hpf. (F) Injection of the p53Spl MO causes an 89 bp shift and destabilization in p53 mRNA. ch, cerotohyal cartilage.