
Fig. 4
- ID
- ZDB-IMAGE-120717-25
- Genes
- Publication
- Oehlers et al., 2012 - Retinoic acid suppresses intestinal mucus production and exacerbates experimental enterocolitis
- All Figures
- Figures for Oehlers et al., 2012
|
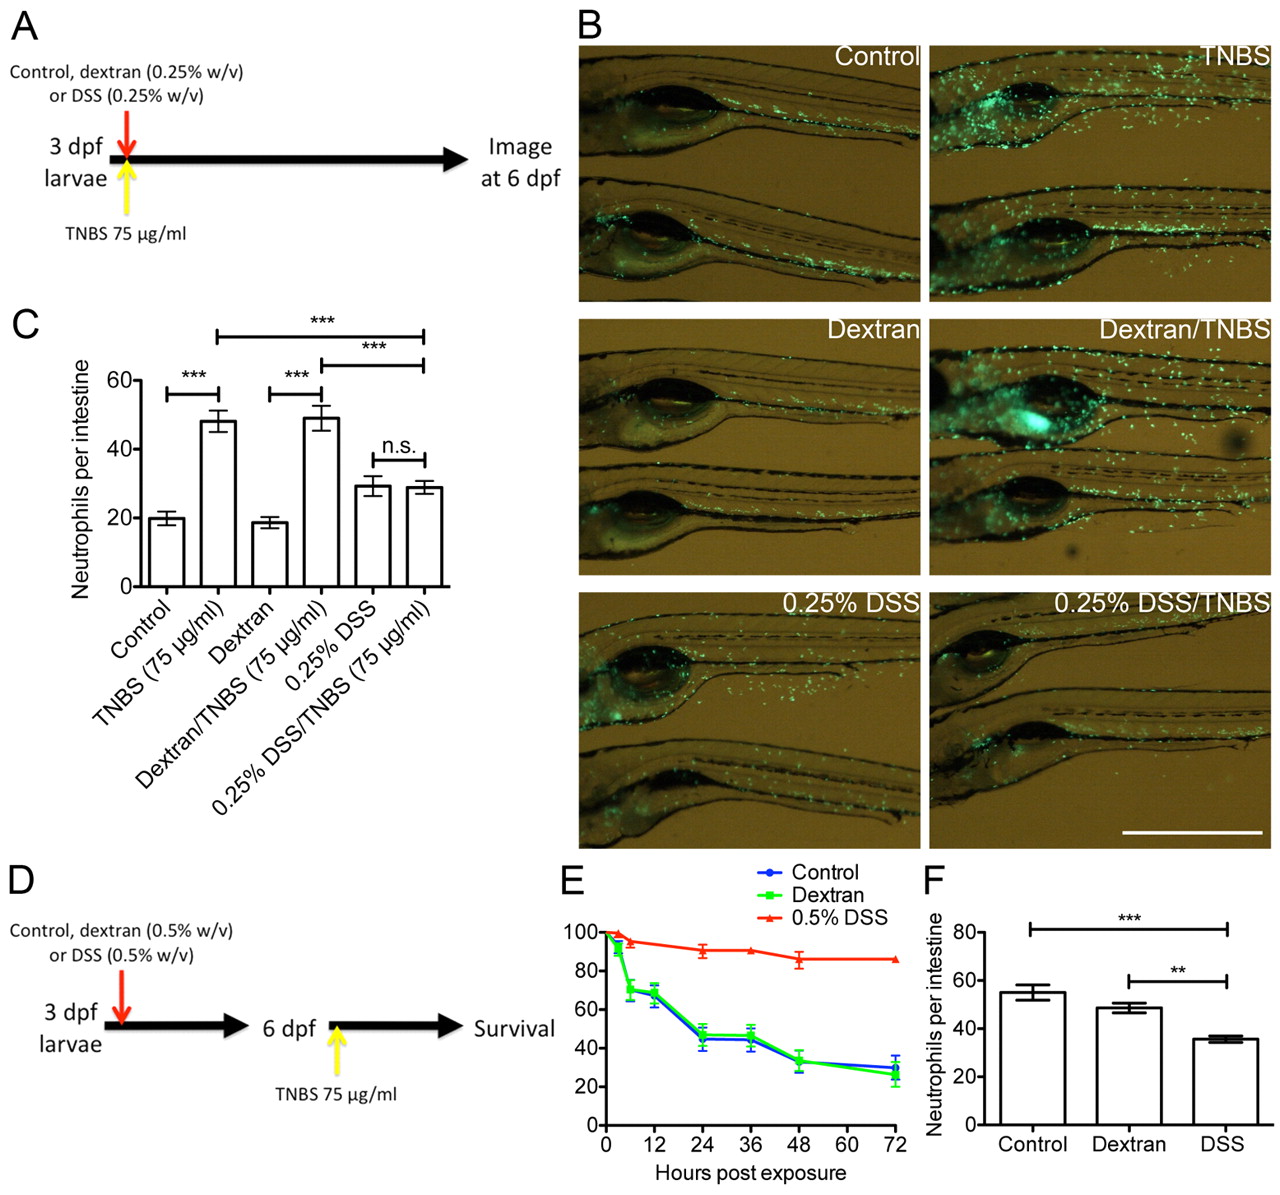
Fig. 4 DSS-induced mucus secretion protects against further chemical-induced enterocolitis. (A) Schematic describing the experimental procedure analyzed in panels B and C. (B) Live imaging of neutrophil distribution in Tg(mpx:EGFP)i114 larvae co-treated as indicated. Scale bar: 1 mm. (C) Enumeration of intestinal neutrophils (n≥22 per group; two biological replicates). Error bars indicate s.e.m.; ***P<0.0001 as determined by ANOVA. (D) Schematic describing the experimental procedure reported in panels E and F. (E) Survival analysis of larvae treated as indicated from 3 dpf and exposed to 75 μg/ml TNBS from 6 dpf (n≥10 per group; six biological replicates). Error bars indicate 95% confidence interval. DSS vs control, DSS vs dextran: P<0.0001 as determined by log-rank test. (F) Enumeration of intestinal neutrophils in larvae exposed to 75 μg/ml TNBS from 6 dpf and assayed at 24 hours post-TNBS exposure (n≥12 per group; three biological replicates). Error bars indicate s.e.m.; ***P<0.0001, **P<0.01 as determined by ANOVA.