
Image
|
Figure Caption
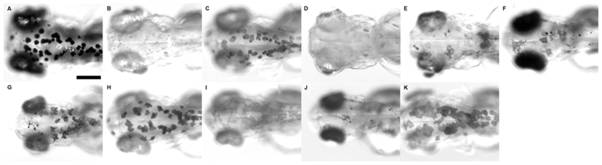
Fig. 7 Morphology of zebrafish after treatment with various tyrosinase inhibitors.
Different tyrosinase inhibitors, when applied at the same stage as PTU singly or in combination, suppress pigmentation to a different extent at 3 dpf. The inhibitors and their combinations include: (A) untreated control, (B) 1X PTU, (C) 0.3X PTU, (D) 10 μM MBT, (E) 0.25 mM MQ, (F) 0.7 mM 4HBA, (G) 0.8 mM HPU, (H) 0.3X PTU +0.7mM 4HBA, (I) 0.3X PTU +0.8 mM HPU, (J) 0.8 mM HPU +0.7 mM 4HBA and (K) 0.3X PTU +0.8 mM HPU +0.7 mM 4HBA. Scale bar = 100 μm.
Acknowledgments
This image is the copyrighted work of the attributed author or publisher, and
ZFIN has permission only to display this image to its users.
Additional permissions should be obtained from the applicable author or publisher of the image.
Full text @ PLoS One