
|
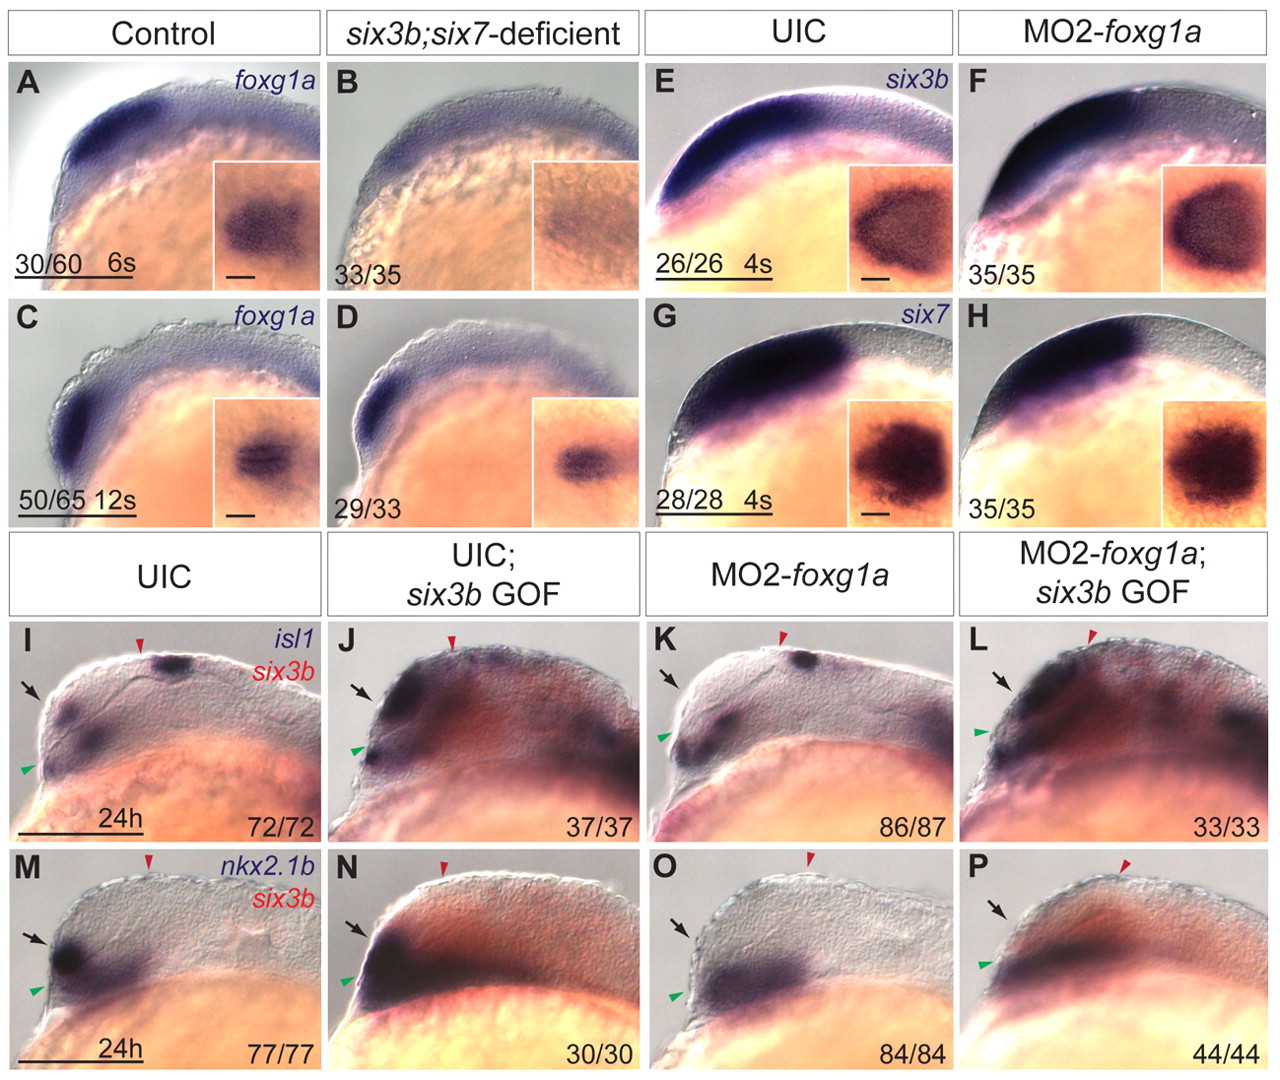
Fig. 7 Interaction between Six3 and Foxg1a in ventral telencephalon development. (A-D) Expression of foxg1a in control (A,C) and six3b;six7-deficient (B,D) embryos at the 6-somite stage (A,B) and 12-somite stage (C,D). (E-H) Expression of six3b (E,F) and six7 (G,H) in uninjected control (UIC) embryos (E,G) and MO2-foxg1a injected embryos (F,H) at the 4-somite stage. Insets in E-H are dorsal views of the same embryo with anterior leftwards. Inset scale bars: 50 μm. (I-P) isl1 (purple) (I-L) or nkx2.1b (purple) (M-P) and six3b (red) expression in UIC embryos (I,M), UIC Tg(hsp70l:Gal4-VP16); Tg(UAS:six3b) embryos misexpressing six3b (J,N), MO2-foxg1a injected embryos (K,O) and MO2-foxg1a injected Tg(hsp70l:Gal4-VP16); Tg(UAS:six3b) embryos misexpressing six3b (L,P) at 24 hpf. Embryos are shown in lateral view with anterior towards the left. Red and green arrowheads indicate dorsal and ventral edges of the telencephalon, respectively. Arrows indicate telencephalic expression domains. Scale bars: 100 μm.