
Fig. S7
- ID
- ZDB-IMAGE-120601-74
- Publication
- van der Velden et al., 2012 - The Polycomb group protein Ring1b is essential for pectoral fin development
- All Figures
- Figures for van der Velden et al., 2012
|
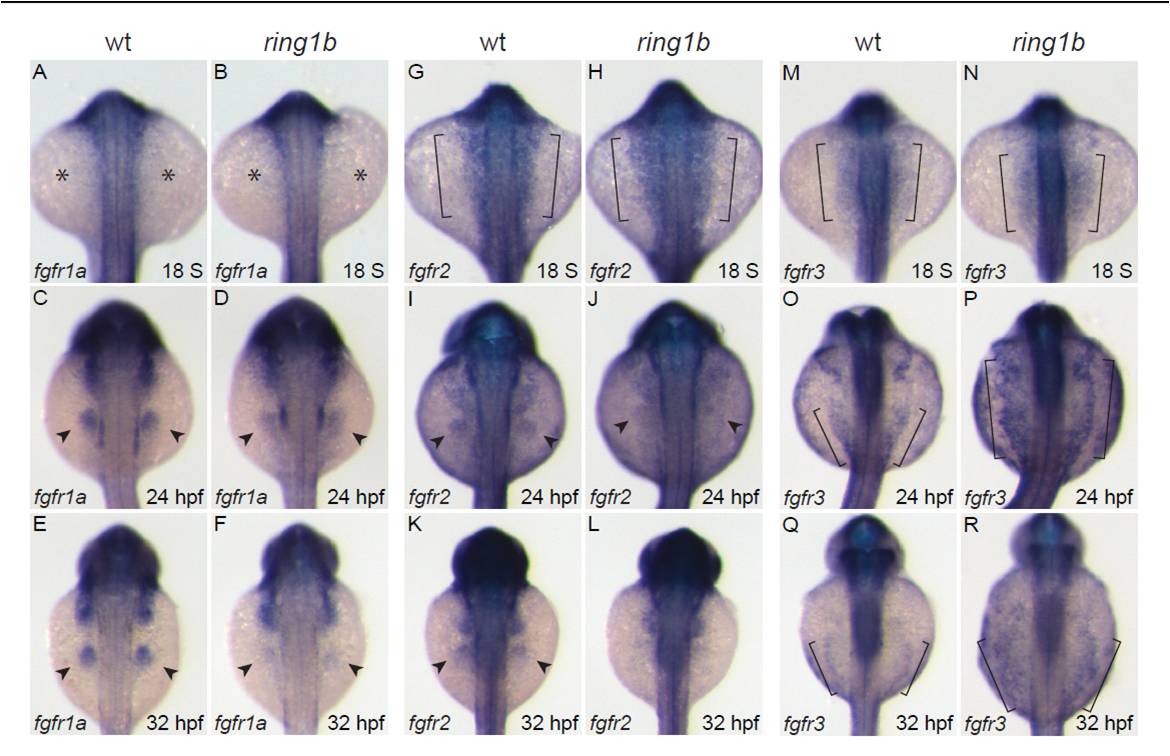
Fig. S7 Time-course expression analysis of the FGF receptors. (A-R) Dorsal views of in situ hybridization for fgfr1a (A-F), fgfr2 (G-L) and fgfr3 (M-R). fgfr1a is not expressed in either wild type or ring1b LPM at 18 ss (A,B; asterisks indicate absence of expression). At 24 hpf, fgfr1a is expressed in the fin buds of wild-type embryos and at weaker levels in ring1b fin buds (C,D). At 32 hpf, strong fgfr1 expression is detected in the wild-type fin buds but is greatly reduced in the ring1b fin buds (E,F). fgfr2 is expressed in the LPM of wild-type and ring1b embryos at 18 ss (brackets, G,H). At 24 hpf, fgfr2 expression in ring1b fin buds is weak (I,J) and is hardly detectable in ring1b fin buds at 32 hpf (K,L). fgfr3 is expressed at higher levels in the LPM of ring1b mutants at 18 ss (M,N). At 24 hpf, fgfr3 expression is upregulated and expanded in mutants (O,P). At 32 hpf, fgfr3 remains high and the expression domain is expanded in ring1b embryos (Q,R). Brackets in M-R indicate the LPM.