
Fig. S1
- ID
- ZDB-IMAGE-120601-52
- Publication
- Breau et al., 2012 - Chemokine and Fgf signalling act as opposing guidance cues in formation of the lateral line primordium
- All Figures
- Figures for Breau et al., 2012
|
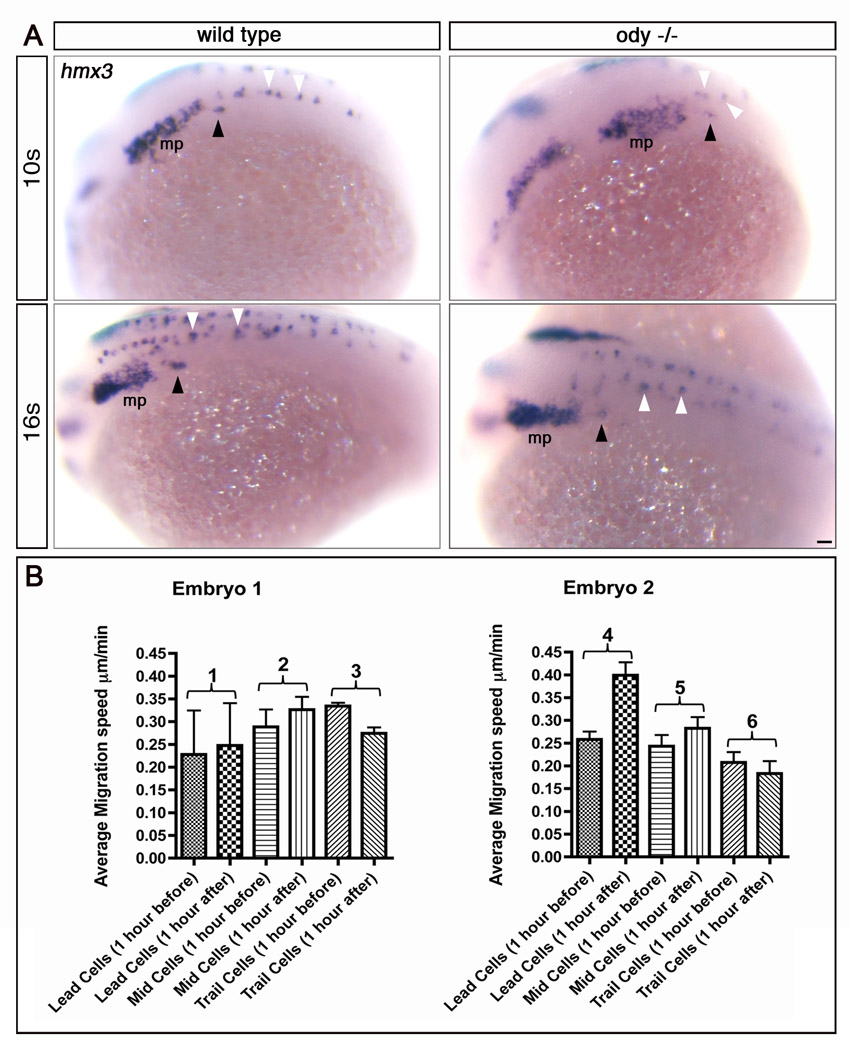
Fig. S1 Increased migration of the primorduim after fusion with SPCs. (A) Detection of SPCs from the 10s stage. Whole-mount hmx3 in situ hybridisation at 10s and 16s in wild-type and ody-/- embryos. Anterior to the left. Black arrowheads indicate SPCs. White arrowheads show hmx3-expressing spinal cord neurons. mp, main primordium placode. Scale bar: 25 µm. (B) Cell tracking of the primordium before and after the fusion. Average speed of leading, mid and trailing primordium cells during 1 hour period before and after the fusion between SPCs and the main primordium. P values: 1=0.018, 2=0.028, 3=0.015, 4=0.0001, 5=0.040 and 6=0.258.