
IMAGE
Fig. 3
- ID
- ZDB-IMAGE-120601-44
- Publication
- Breau et al., 2012 - Chemokine and Fgf signalling act as opposing guidance cues in formation of the lateral line primordium
- All Figures
- Figures for Breau et al., 2012
Image
|
Figure Caption
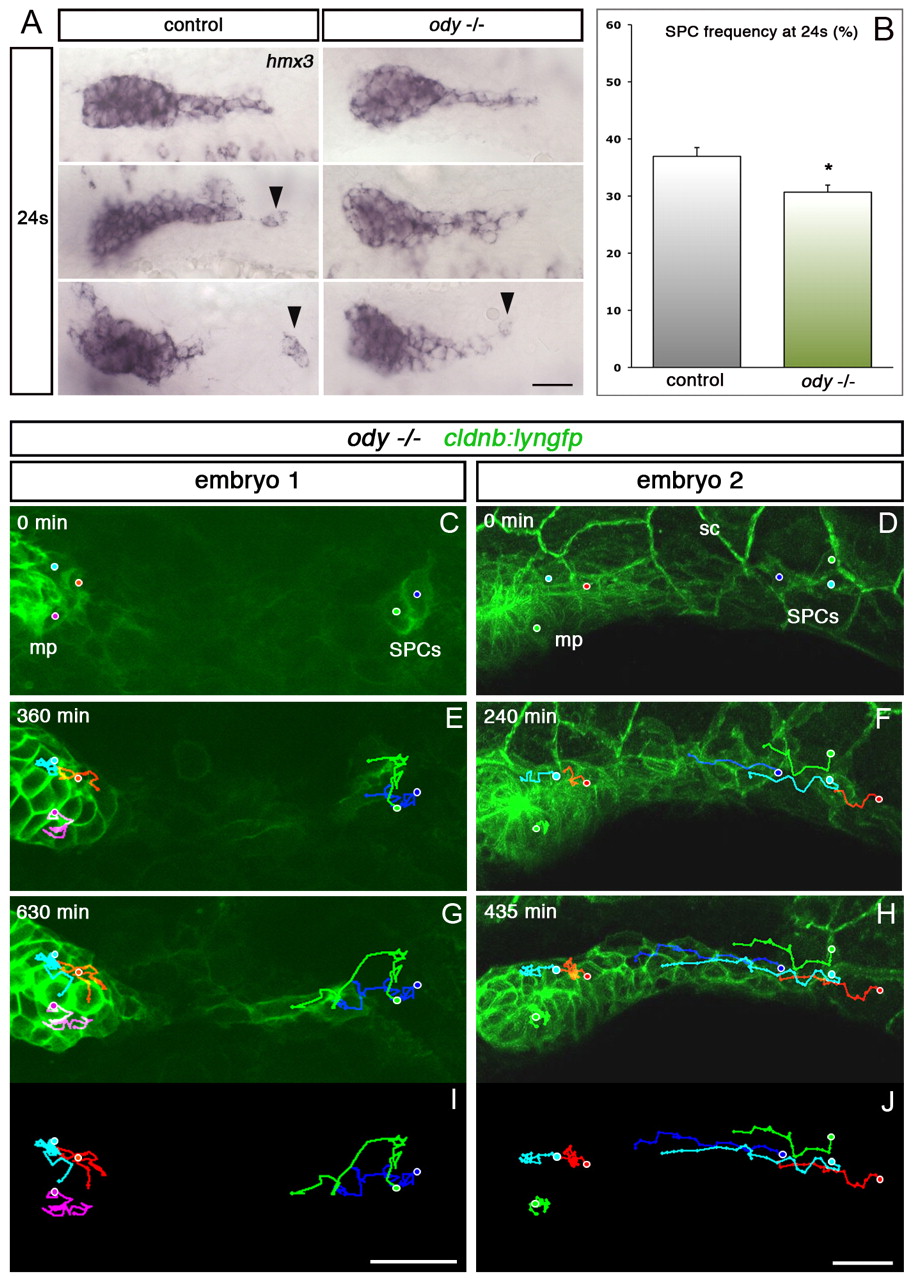
Fig. 3 Cxcr4b attracts SPCs caudally. (A) hmx3 expression at 24s in control and ody–/– embryos. Black arrowheads indicate SPCs. (B) SPC frequency analysed by hmx3 expression in ody–/– and stage-matched controls at 24s. *P=0.013. Error bars indicate s.e.m. (C-J) Tracking of the SPCs and primordium tip cells in two ody–/– embryos (supplementary material Movie 5). In C and D, dots show initial positions of tracked cells. E and F show intermediate time points and G-J show final time points. Scale bars: 25 μm.
Acknowledgments
This image is the copyrighted work of the attributed author or publisher, and
ZFIN has permission only to display this image to its users.
Additional permissions should be obtained from the applicable author or publisher of the image.
Full text @ Development