
Image
|
Figure Caption
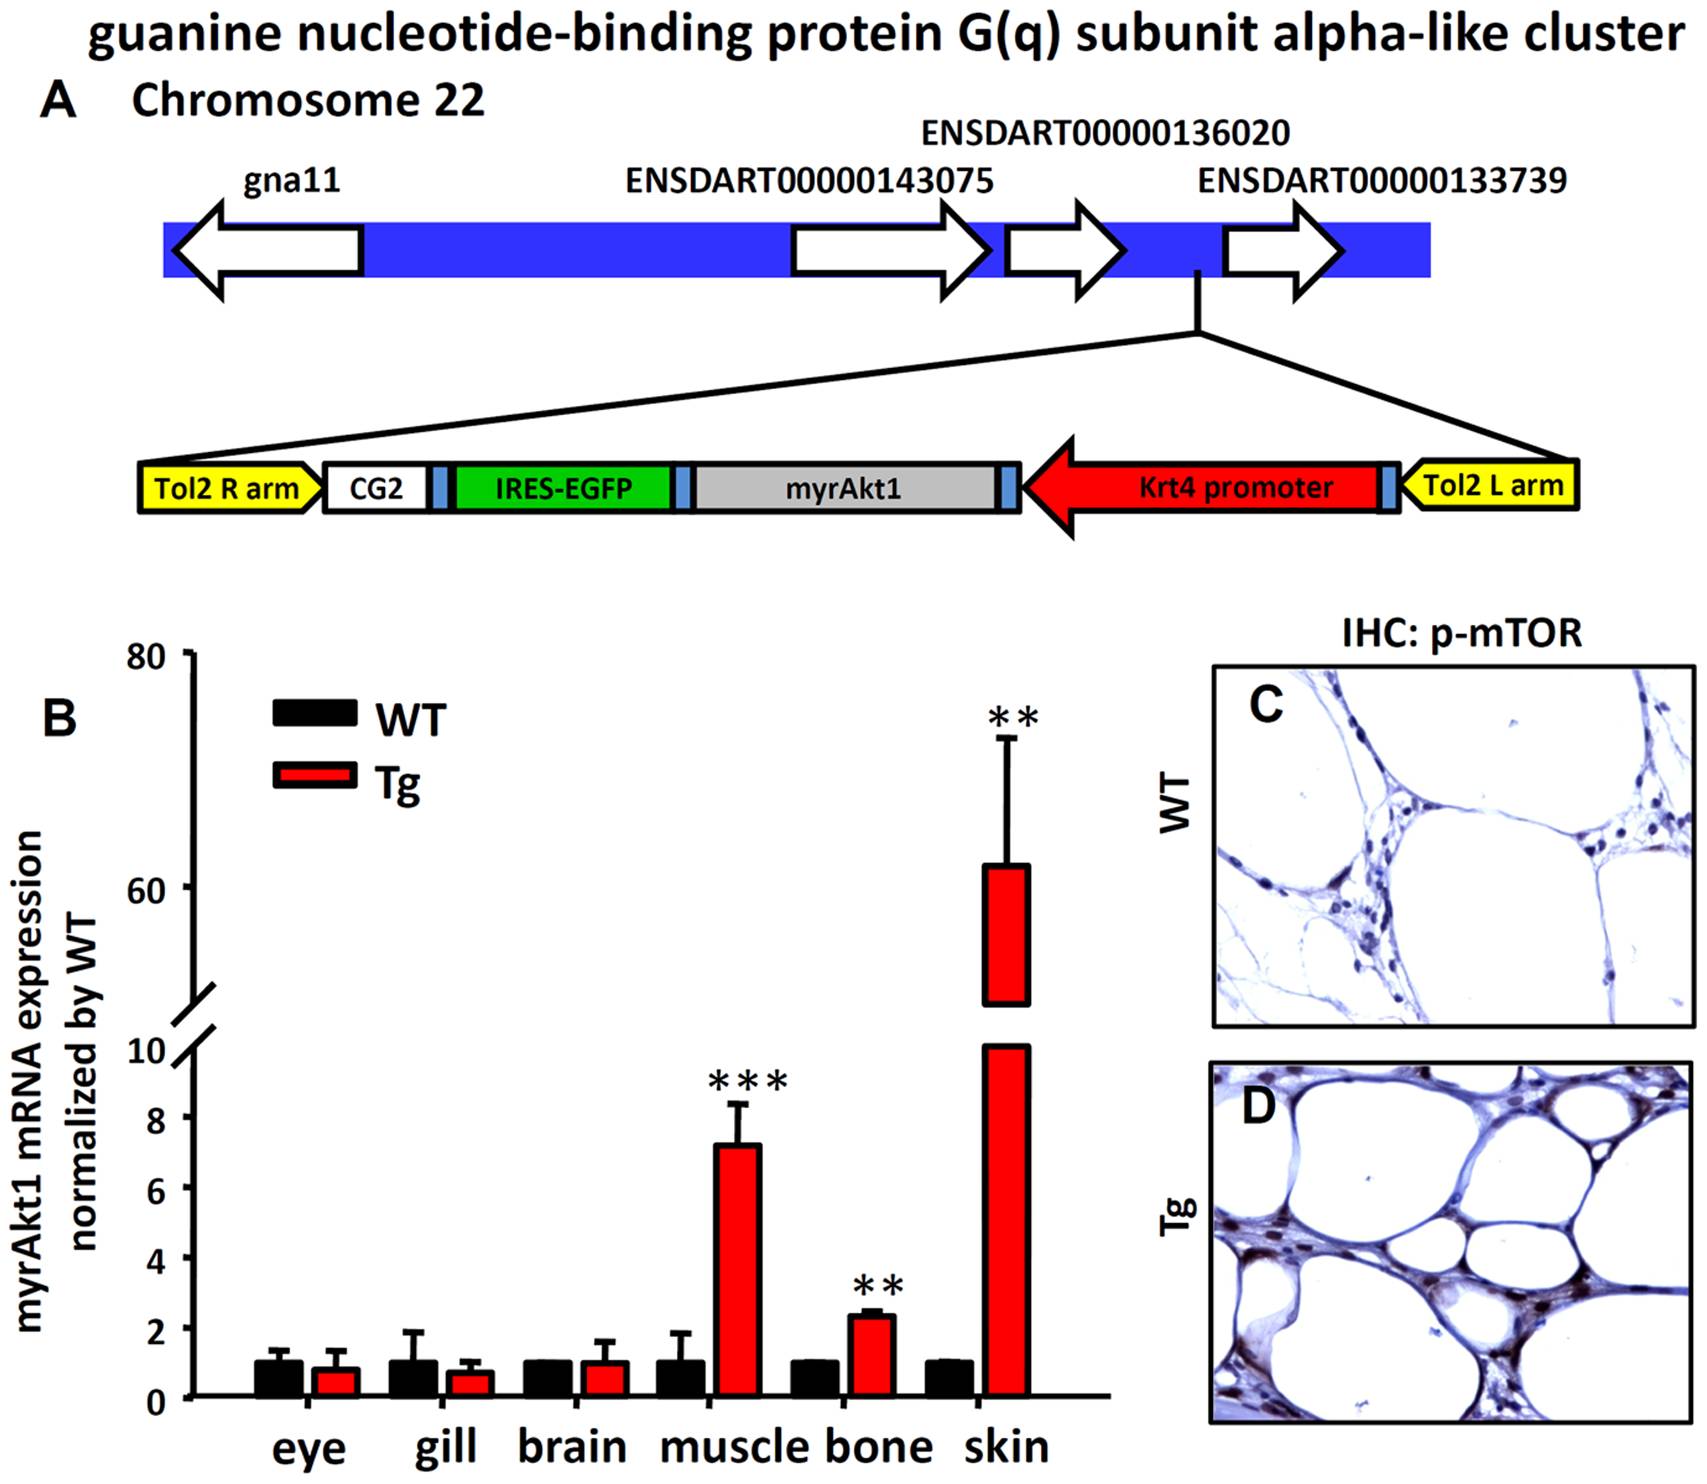
Fig. 6 Detection of the ectopic expression of myrAkt1 transgene in Tg(krt4:Hsa.myrAkt1)cy18.
(A) Schematic diagram showing the chromosomal integration site in Tg. (B) Relative expression level of myrAkt1 transgene among different tissues assayed by real-time RT-PCR. Stars above the error bars indicate significant differences as tested by Student’s t-test (**p<0.01, and ***p<0.001). The detection of the expression of a Akt downstream target of phospho-mTOR in the adipose tissues of WT (C) and Tg (D) by immunohistochemistry. WT, wild type; Tg, Tg (krt4:Hsa.myrAkt1)cy18.
Figure Data
Acknowledgments
This image is the copyrighted work of the attributed author or publisher, and
ZFIN has permission only to display this image to its users.
Additional permissions should be obtained from the applicable author or publisher of the image.
Full text @ PLoS One