
|
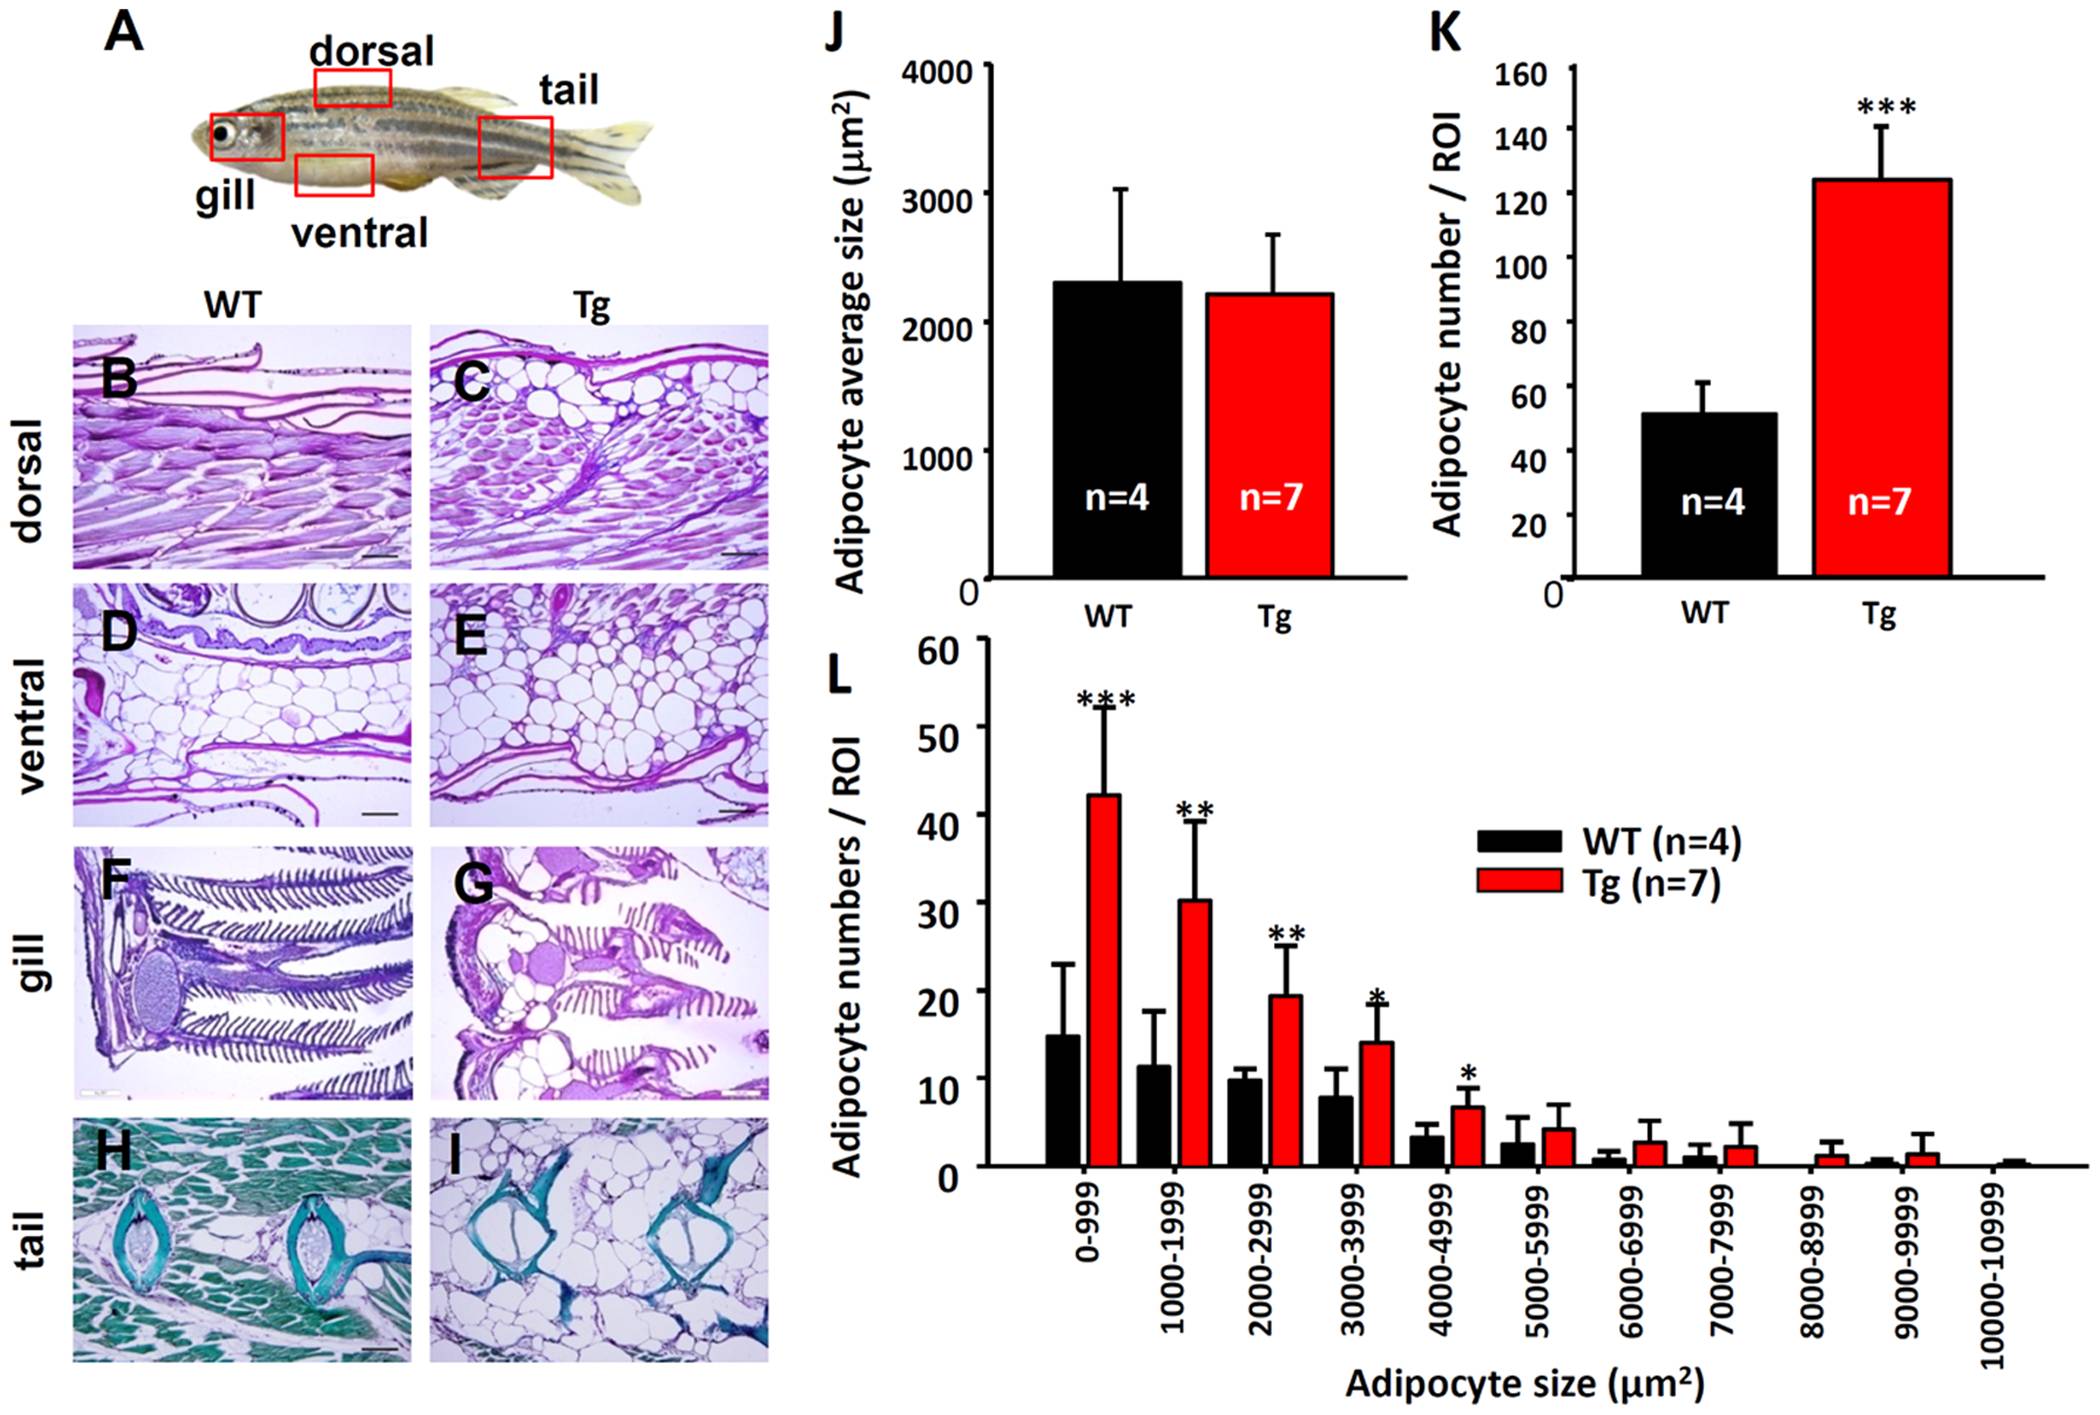
Fig. 5 Histology of the obese transformed Tg (krt4:Hsa.myrAkt1)cy18.
(A) Schematic diagram showing the relative positions (red dotted boxes) for histological sections from B to I. Histological assessment of dorsal muscle tissues (B and C), visceral adipocytes (D and E), gill arch (F and G) and bone tissues in the tail (H and I) for WT and Tg aged 3 mpf. The paraffin sections in B to G were stained with Periodic acid-Schiff, and bone tissues in the tail regions (H&I) were stained with Masson’s trichrome. Comparison adipocyte average size (J), adipocyte numbers (K), and adipocyte size distribution histogram (L) between WT and Tg. Stars above the error bars indicate significant differences as tested by Student’s t-test (*p<0.05, **p<0.01, and ***p<0.001). WT, wild type; Tg, Tg(krt4:Hsa.myrAkt1)cy18; mpf, month post-fertilization.