
IMAGE
Fig. S3
- ID
- ZDB-IMAGE-120601-3
- Publication
- Yue et al., 2012 - Thrombin Receptor Regulates Hematopoiesis and Endothelial-to-Hematopoietic Transition
- All Figures
- Figures for Yue et al., 2012
Image
|
Figure Caption
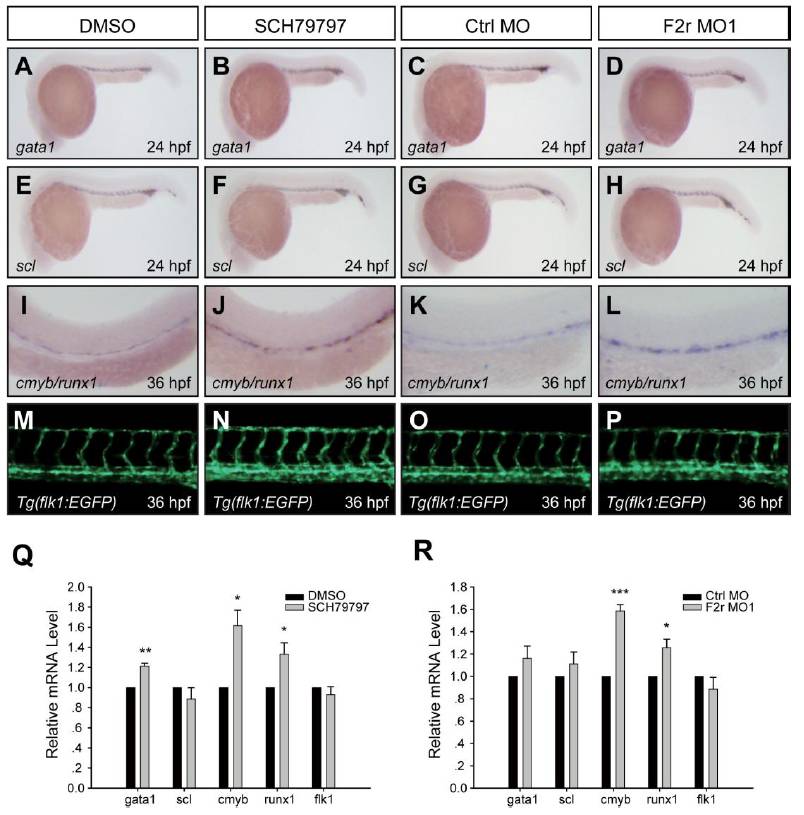
Fig. S3 (A-H) WISH analyses of ICM markers gata1 and scl at 24 hpf. (I-L) WISH analyses of HSC markers cmyb and runx1 (cmyb/runx1) simultaneously at 36 hpf. The AGM regions were shown. (M-P) Fluorescent imaging of vasculatures in Tg(flk1:EGFP) transgenic embryos at 36 hpf. All embryos were lateral views with anterior to the left. (Q and R) qPCR verification of the WISH and fluorescent imaging data. Data shown were means ± SEM of at least three independent experiments, *p < 0.05, **p < 0.01, ***p < 0.001 versus the corresponding control.
Acknowledgments
This image is the copyrighted work of the attributed author or publisher, and
ZFIN has permission only to display this image to its users.
Additional permissions should be obtained from the applicable author or publisher of the image.
Reprinted from Developmental Cell, 22(5), Yue, R., Li, H., Liu, H., Li, Y., Wei, B., Gao, G., Jin, Y., Liu, T., Wei, L., Du, J., and Pei, G., Thrombin Receptor Regulates Hematopoiesis and Endothelial-to-Hematopoietic Transition, 1092-1100, Copyright (2012) with permission from Elsevier. Full text @ Dev. Cell