
|
Fig. 3
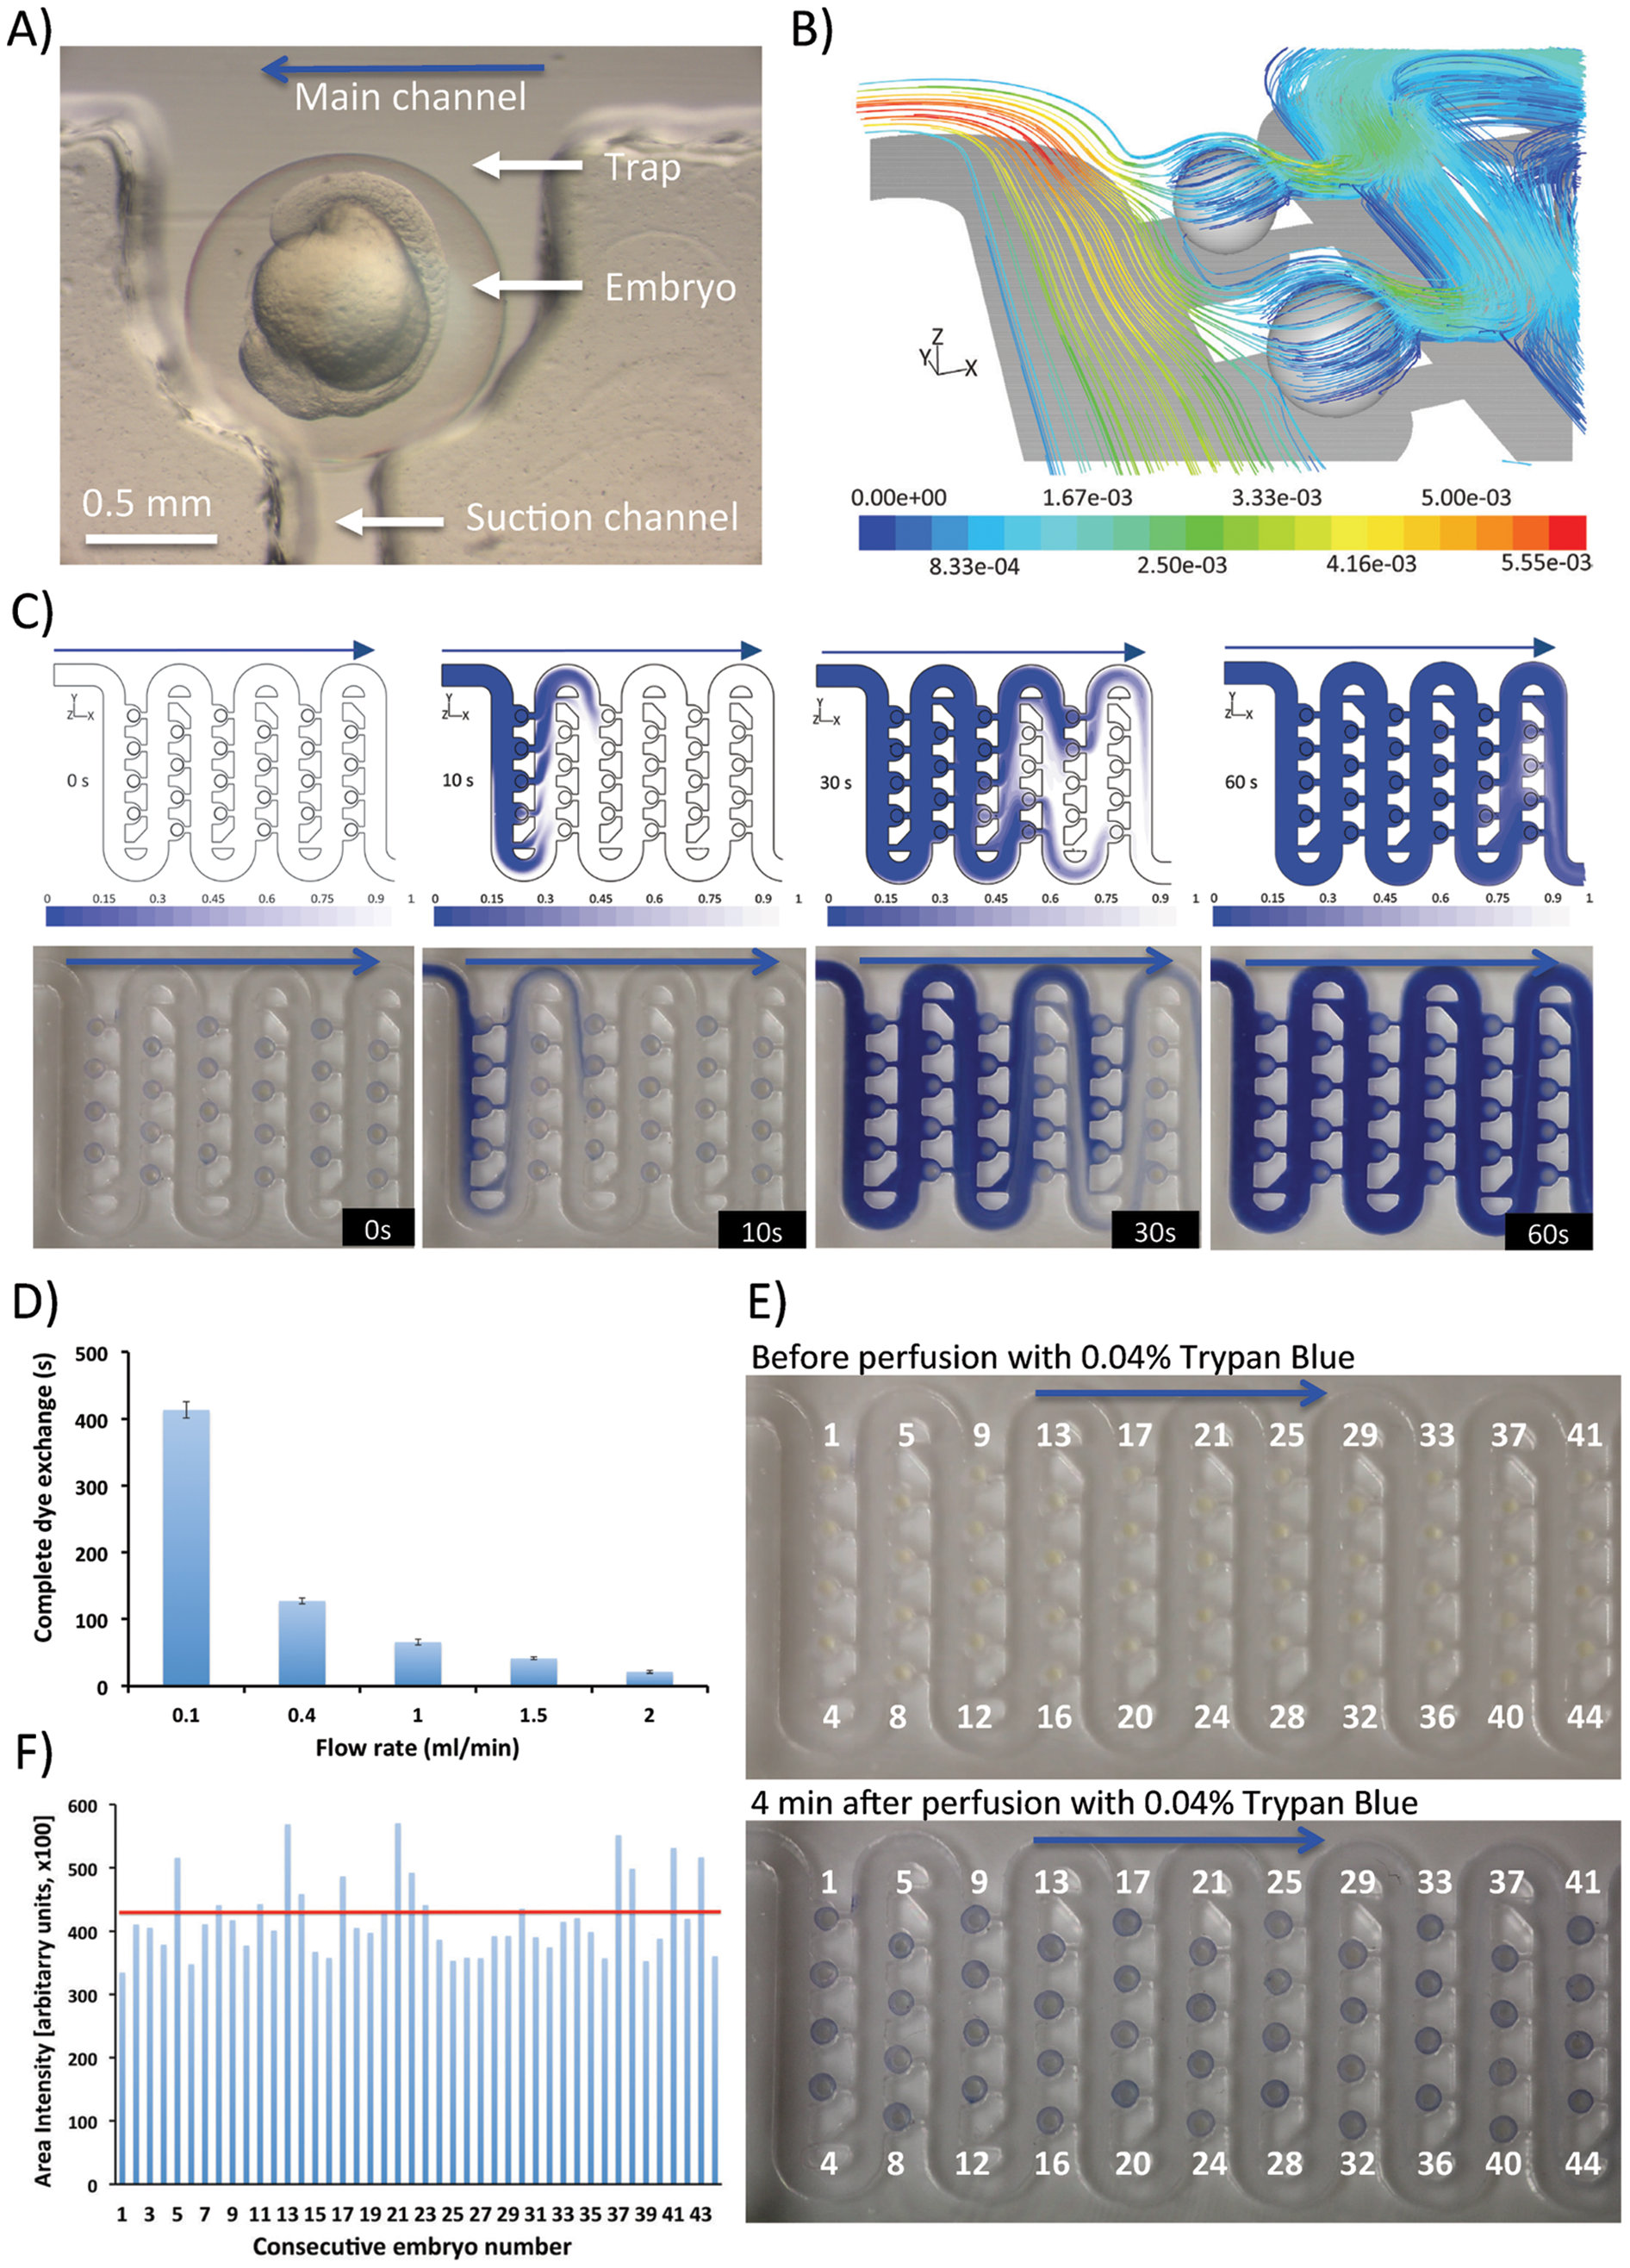
Validation of embryo microperfusion and drug delivery inside the chip:
A) Microphotograph showing a single immobilized zebrafish embryo (circa 16 hpf); B) 3D streamlines of fluid around the embryos colored by flow velocity (m/s) obtained by computational fluid dynamic simulations as the fluid enters two traps occupied by docked embryos. Perfusion was simulated at a volumetric flow rate of 0.4 ml/min; C) Mass transfer across the simulated (upper panel) and real-world (lower panel) microfluidic array fully loaded with zebrafish embryos. Chip was perfused with a 0.04% Trypan Blue dye at a volumetric flow rate of 0.4 ml/min; D) Experimental analysis of the time needed for a complete dye exchange across the whole device (12 rows) at varying flow rates 0.1–2 ml/min.; E) Validation of the dye delivery to each embryo across the microfluidic array. Chip was perfused with a 0.04% Trypan Blue dye at a volumetric flow rate of 0.4 ml/min for up to 4 minutes. Trypan Blue was then replaced with medium; F) Intensity of dye across each embryo obtained by image analysis of the experiments in E). Red line denotes the average staining intensity. Blue arrows depict the direction of fluid flow and embryo movement along the serpentine channel.