
|
Fig. S7
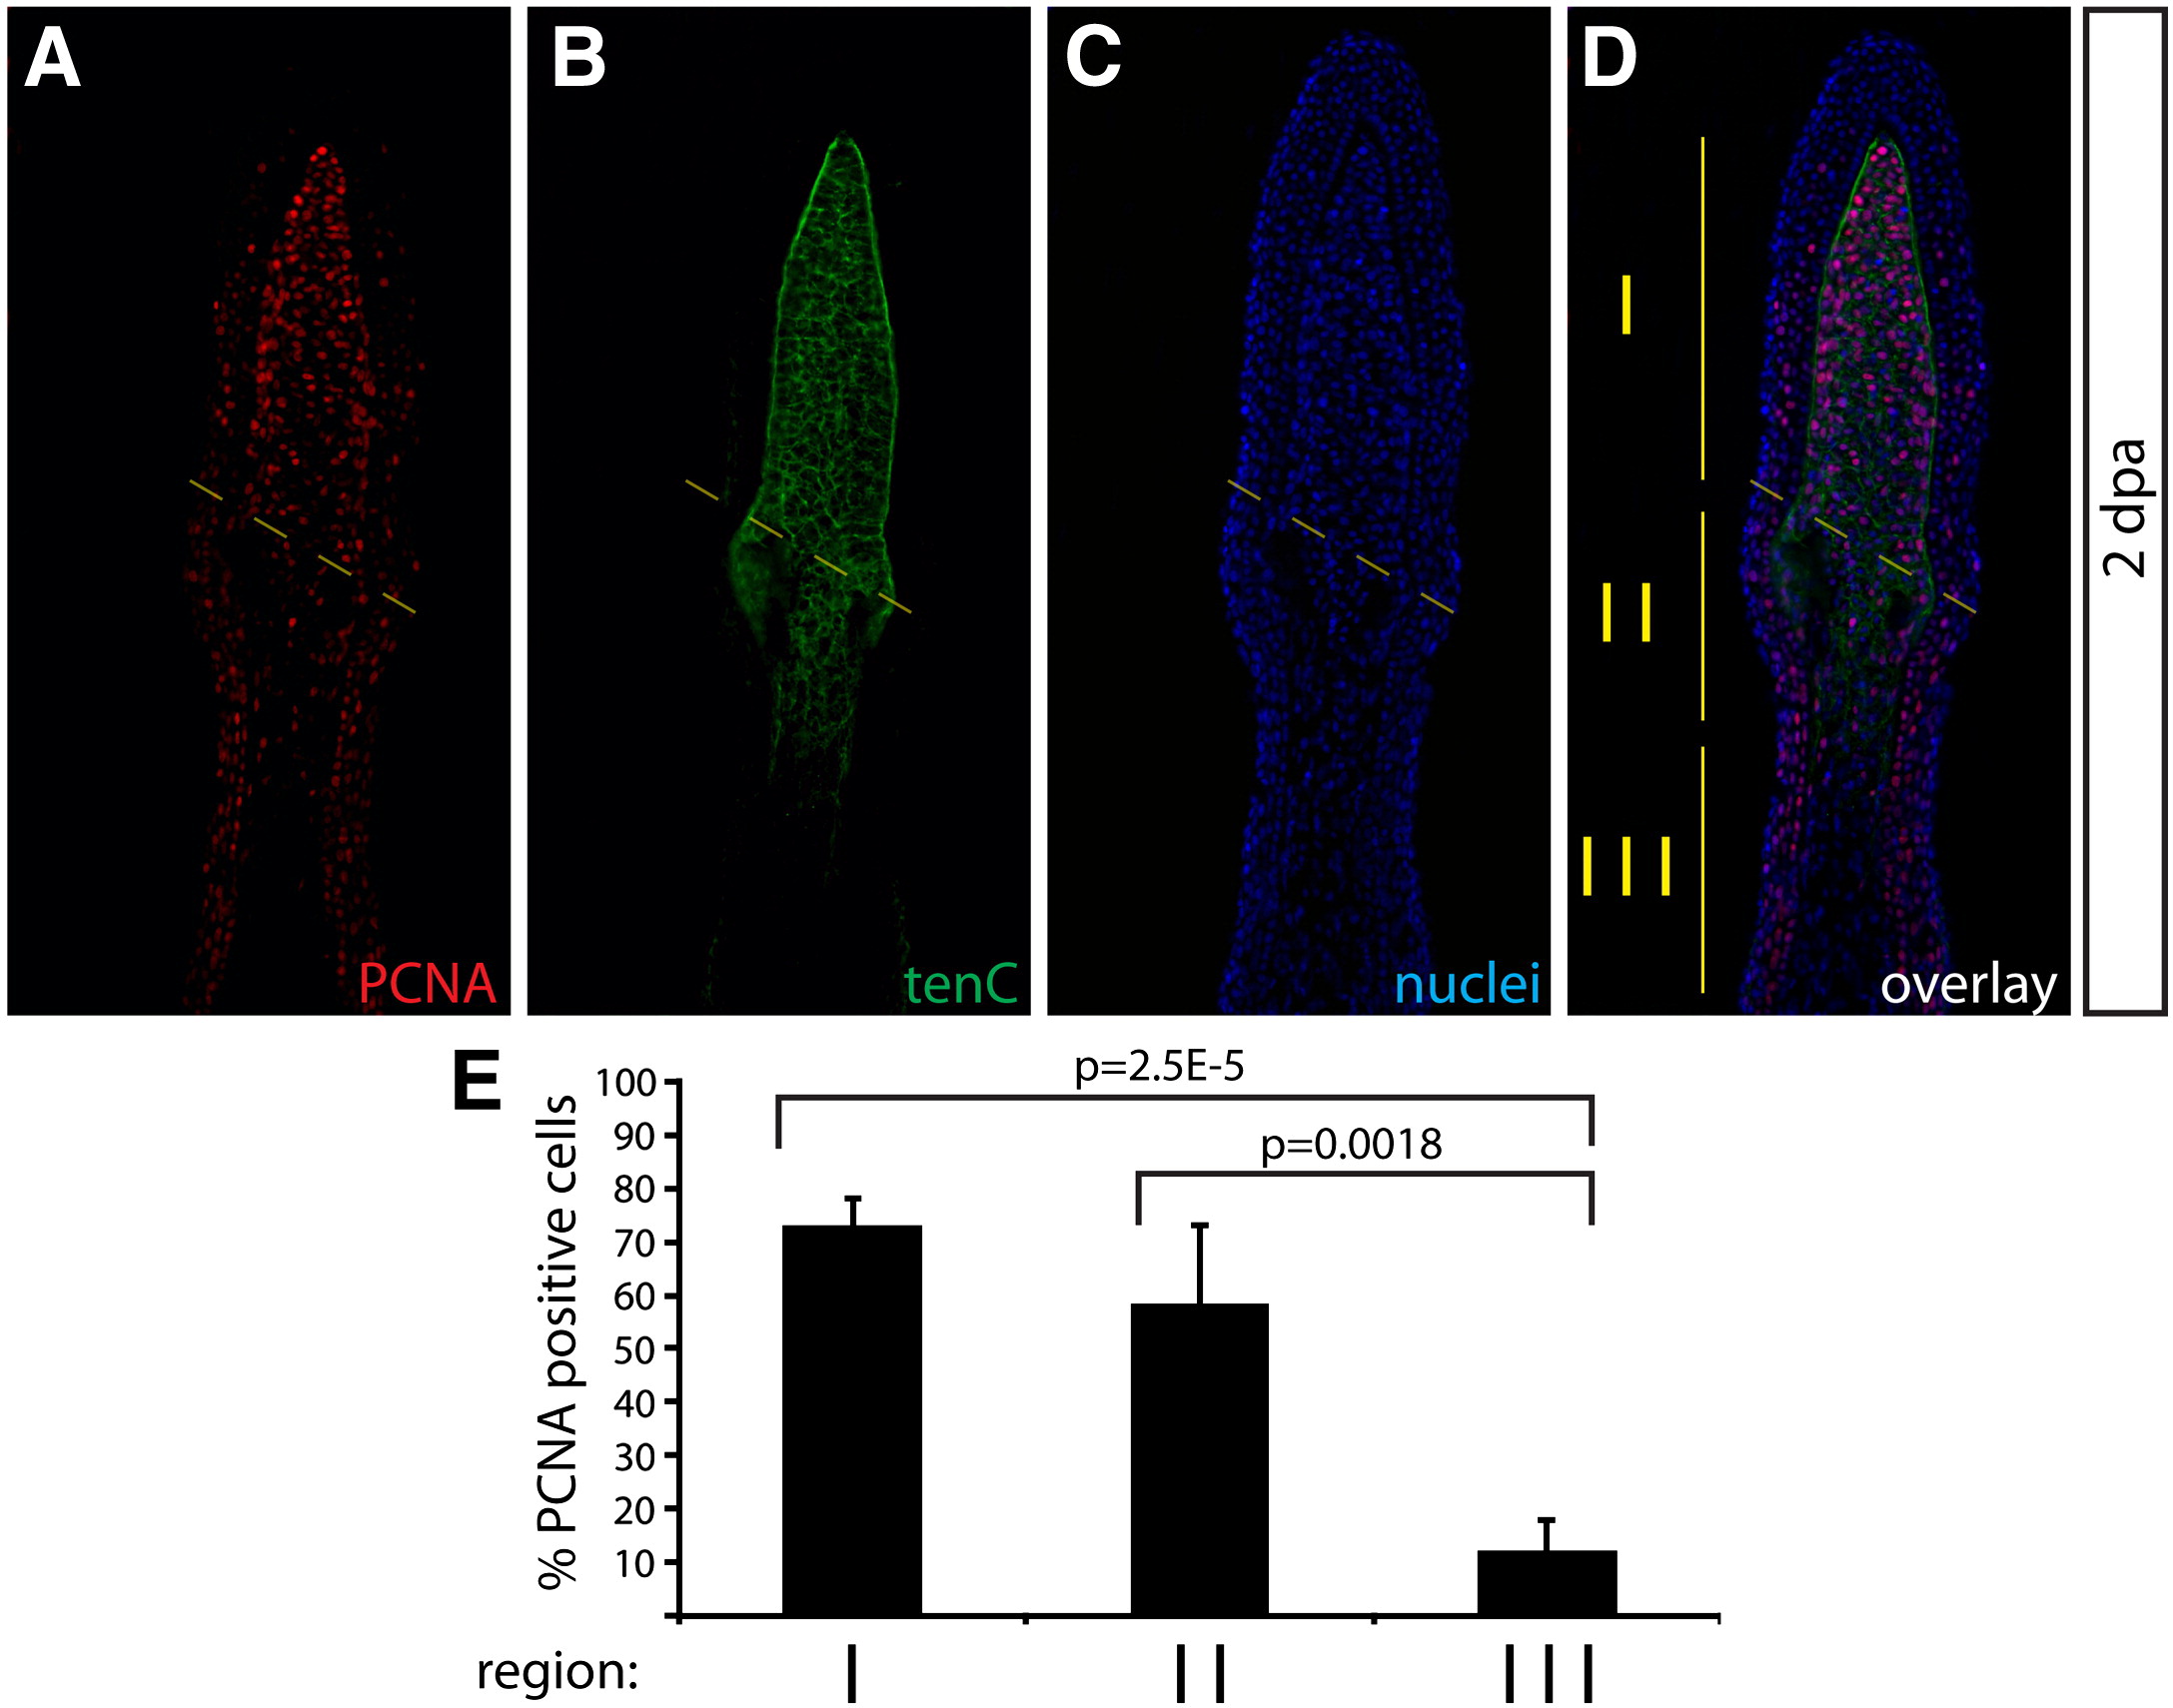
Cell proliferation is increased in tenascin C matrix localized blastema cells. (A–D) A representative image of a caudal fin harvested 2 dpa stained with anti-PCNA (A, red) and anti-tenascin C antibodies (B, green). Hoechst staining marks nuclei (C, blue). The amputation site is shown with a dashed light yellow line. The vertical solid yellow lines in the overlay (D) distinguish three regions in the regenerating fin marked by being distal (region I) or proximal (regions II and III) to the amputation site and by the presence of a tenascin C+ extracellular matrix (regions I and II). (E) A bar graph showing the mean percent of PCNA+ proliferating cells in each denoted region of the regenerating fin. Error bars represent the standard deviation between four animals. P values are calculated using a Student′s t-test.
Reprinted from Developmental Biology, 365(2), Stewart, S., and Stankunas, K., Limited dedifferentiation provides replacement tissue during zebrafish fin regeneration, 339-349, Copyright (2012) with permission from Elsevier. Full text @ Dev. Biol.