
Fig. 6
- ID
- ZDB-IMAGE-120412-6
- Genes
- Publication
- Nakao et al., 2012 - The role of mislocalized phototransduction in photoreceptor cell death of retinitis pigmentosa
- All Figures
- Figures for Nakao et al., 2012
|
Fig. 6
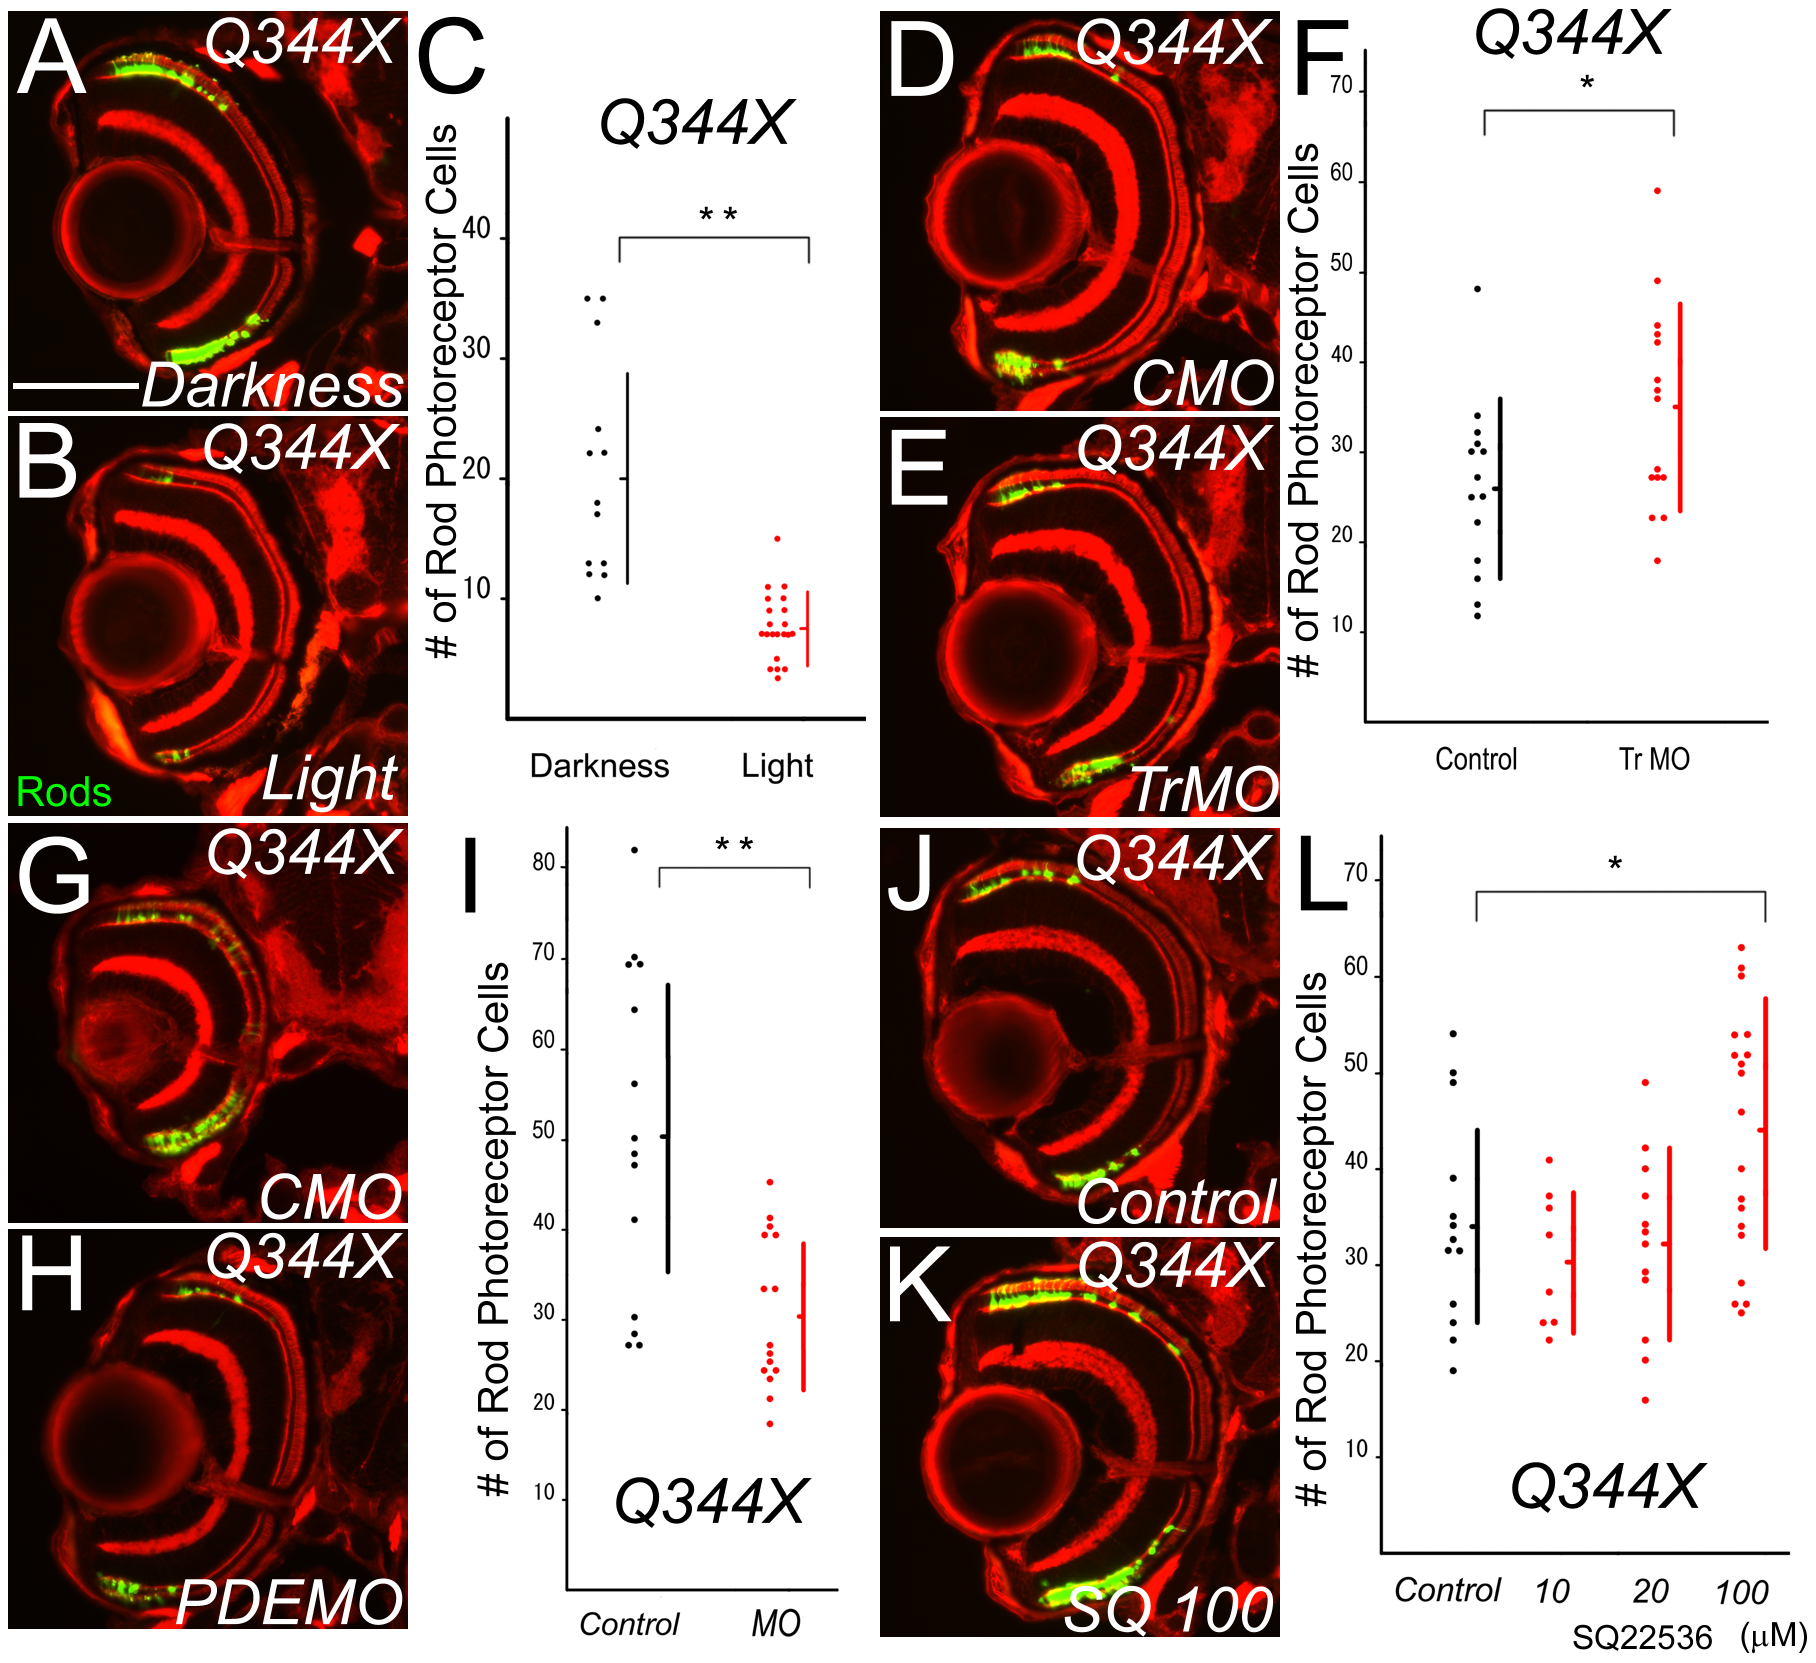
Effects on photoreceptor cell death in Q344X fish.
(A and B) Retina sections of eyes from rhodopsin Q344X transgenic at 5 dpf. Animals were reared in constant darkness (A) or in constant light (B). Light exposure reduces the survival of rod photoreceptor cells. Rod photoreceptors are visualized by EGFP (Bar = 100 μm.) Light accelerated the rod cell death. (C) Graph of the number of rod photoreceptors in rhodopsin Q344X transgenic fish at 5 dpf. Darkness and light exposure are compared. (Bars mean SD, ** means p<0.01.) (D and E) Eye sections of eyes treated by anti-transducin morpholinos (E) and control MO (D) in Q344X at 5 dpf. Suppression of transducin α expression enhances the survival of rod photoreceptor cells. Rod photoreceptors are visualized by EGFP (Bar = 100 μm.). (F) Graph of the number of rods in Q344X, control morpholino-treated and anti-transducin morpholinos. (Bars mean SD, * means p<0.05.) (G and H) Eye sections of eyes treated by anti-phosphodiesterase 6β morpholinos (H) and control MO (G) in Q344X at 5 dpf. Suppression of phosphodiesterase expression reduces the survival of rod photoreceptor cells. Rod photoreceptors are visualized with EGFP (Bar = 100 μm.). (I) Graph of the number of rods in Q344X, control morpholino-treated and anti-phosphodiesterase 6β morpholinos. (Bars mean SD, ** means p<0.01.) (J and K) Eye ections of Q344X transgenic fish bred in SQ22536-treated water (K) and normal control water (J) at 5 dpf. Rod photoreceptors are visualized by EGFP (Bar = 100 μm.) ADCY antagonist rescued rod photoreceptor cell death. (L) Graph of the number of rod photoreceptor cells in Q344X 5 dpf. Black dots indicate control and red dots indicate SQ22536-treated (10, 20 and 100 mM) water. (Bars mean SD, * means p<0.05.)