
|
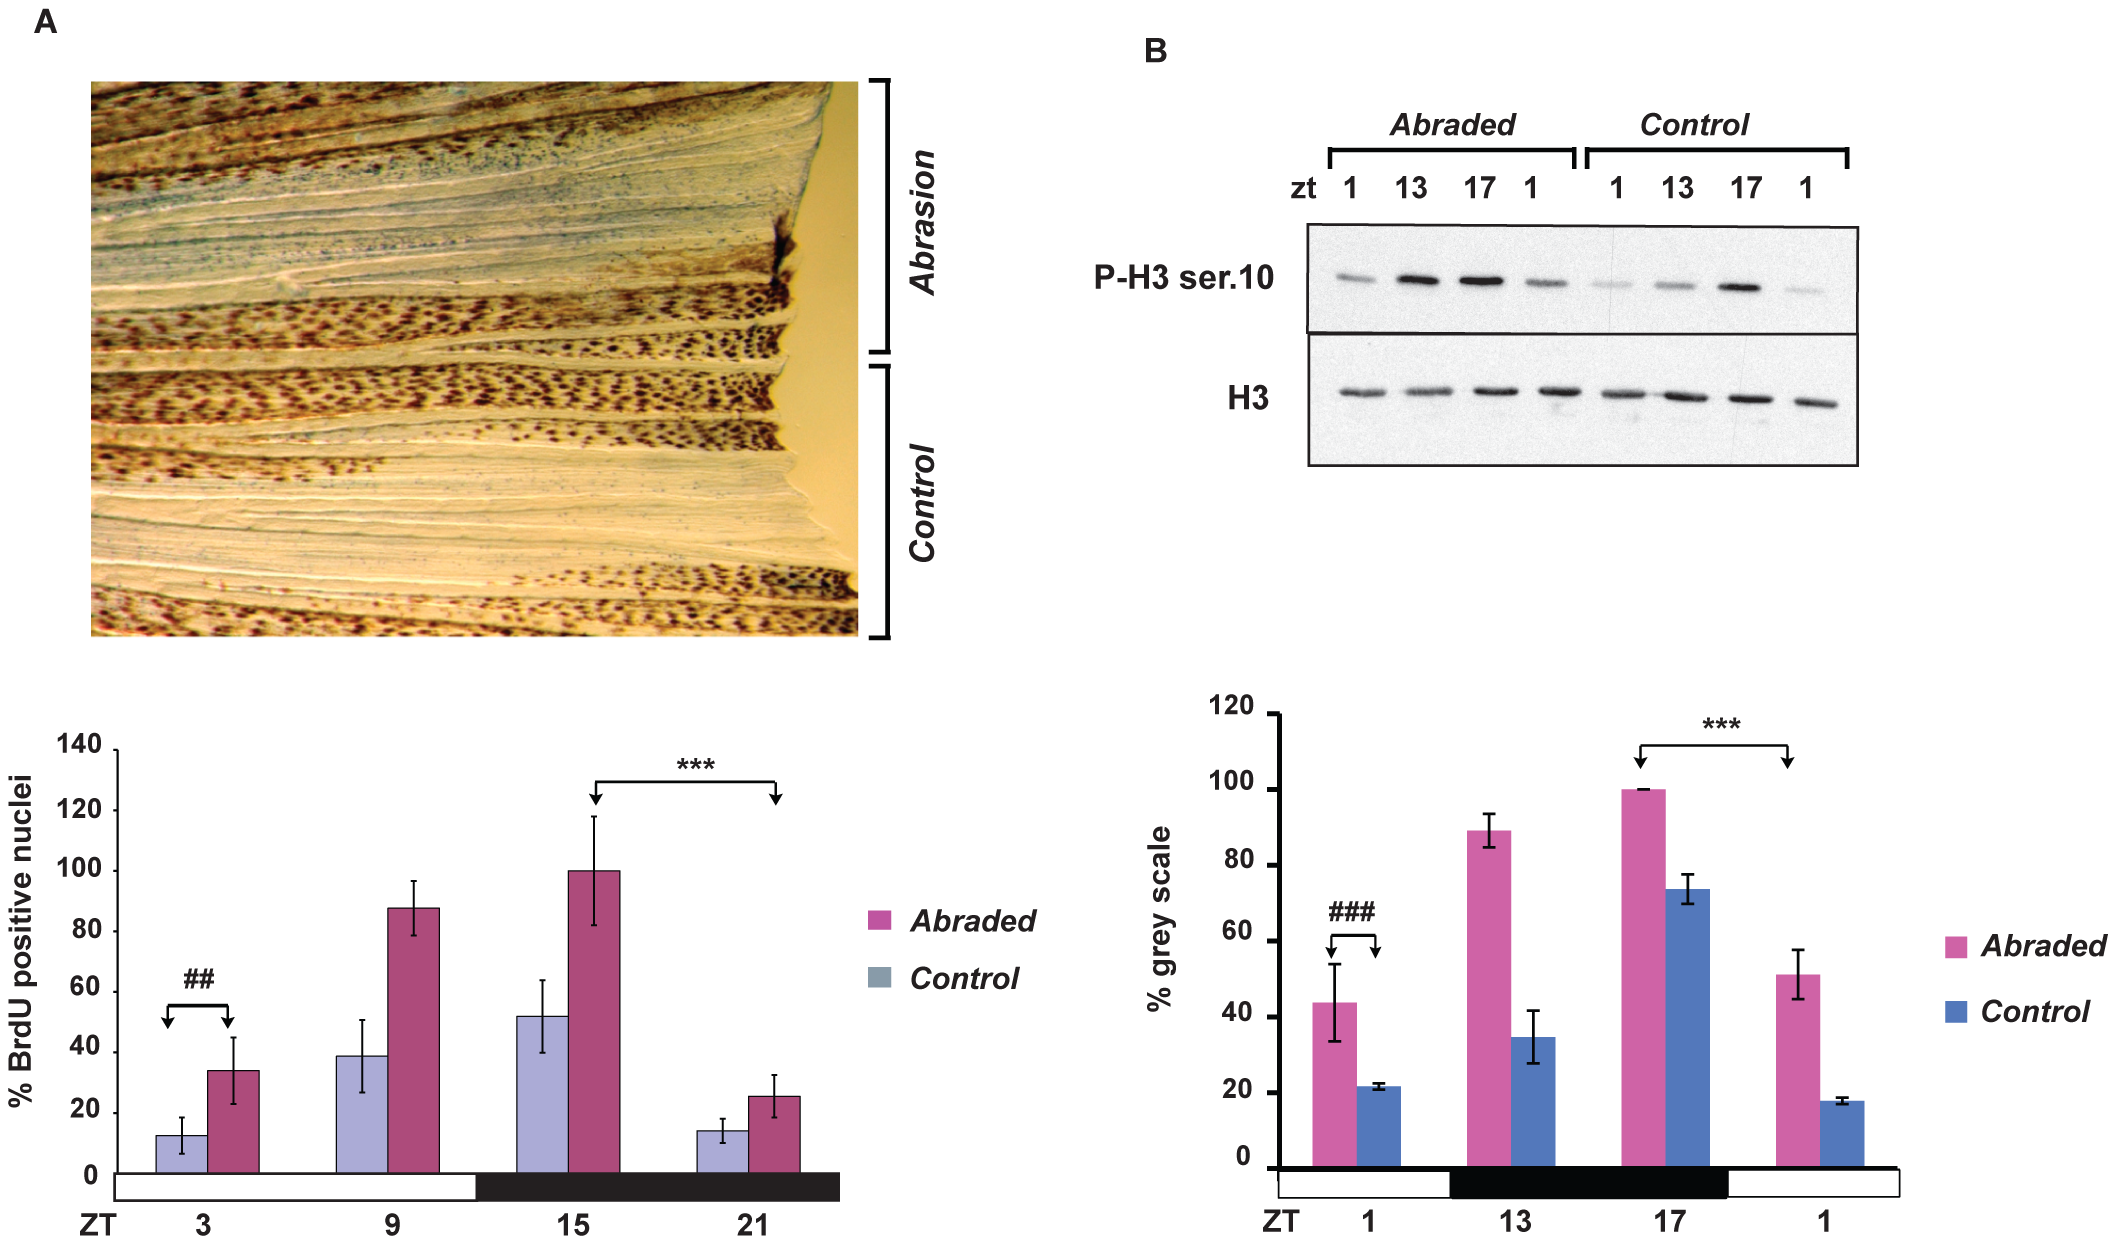
Fig. 6
Mechanical abrasion increases circadian cell proliferation.
(A), Upper section: Representative image of BrdU-stained caudal fin 48 hours after half of its surface was abraded. The remaining, non-treated half of the fin served as an internal control. Lower section: The results of quantification of the number of BrdU positive nuclei measured each 6 hours during one 24 hours period between 24 and 48 hours following abrasion performed at ZT3. On the Y-axis is plotted the % of BrdU positive nuclei with respect to the largest value (ZT15, abraded). (B) Western blot analysis using P-H3 Ser 10 and H3 antibodies and its quantification (below) of whole protein extracts prepared from the abraded and non-abraded (control) sections of fins. On the Y-axis is plotted the % of grey scale with respect to the highest value (ZT17, abraded). The precise times of sample preparation are indicated by ZT times. Each time point represents the mean value +/ SEM calculated for a minimum of n = 6 fish. The results of statistical analysis of the peak and trough values for the abraded fins are indicated by asterisks (Bonferroni′s post hoc test p<0.0001) and horizontal “brackets” above the graphs (A and B). Furthermore, statistically significant differences observed at each time point between the abraded and non-abraded control fins are indicated for simplicity, by the symbol “#” and a bracket above only the first time point (panel A, Bonferroni′s post hoc test p<0.001 and panel B, Bonferroni′s post hoc test p<0.0001). Black and white bars represent the dark and light periods. All the quantitative data were subjected to Cosinor analysis to test for the presence or absence of 24-h rhythmicity (see Table S1, Figure S2).