
Fig. 2
- ID
- ZDB-IMAGE-120329-57
- Publication
- Roostalu et al., 2012 - In Vivo imaging of molecular interactions at damaged sarcolemma
- All Figures
- Figures for Roostalu et al., 2012
|
Fig. 2
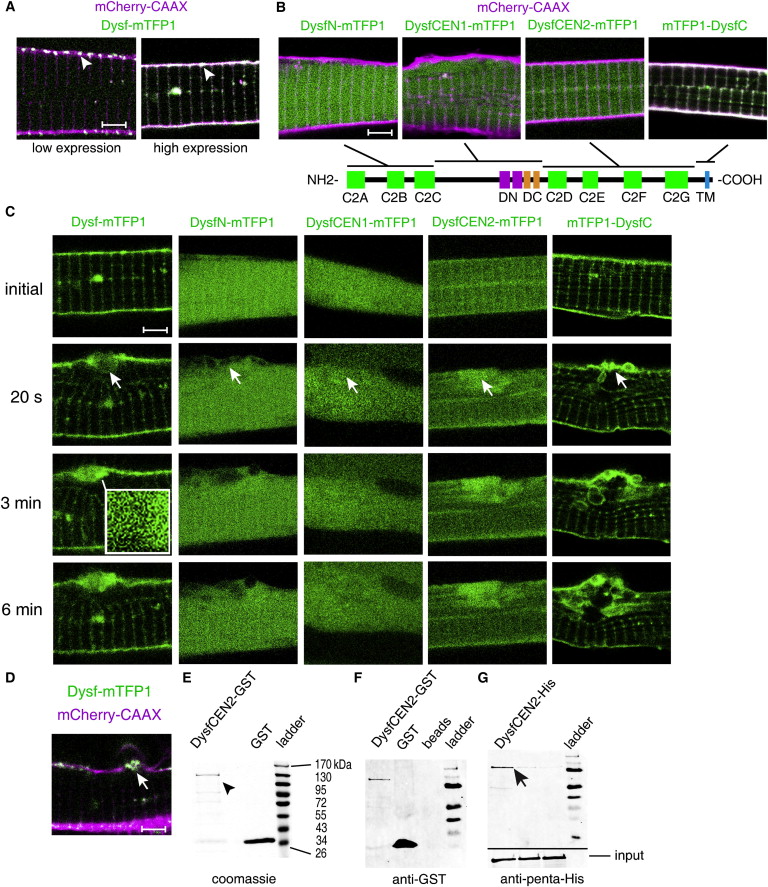
Characterization of Dysf and Its Response to Cell Lesions
Full-length Dysf or parts of it were fused to mTFP1 (green) and expressed in zebrafish. mCherry-CAAX marks cell membrane in magenta.
(A) At low expression levels (left), Dysf accumulates preferentially at the neck regions of T-tubules (arrowhead) but is more uniformly distributed along the plasma membrane at higher levels (right).
(B) Domain architecture of Dysf and subcellular location of individual regions. mTFP1 was fused to the C terminus, except for the TM domain (DysfC construct), where it was fused to the N-terminus. Only the C-terminal part of Dysf (DysfC) localizes to the plasma membrane.
(C) Response of Dysf, Dysf N-terminal domain (DysfN), DysfCEN1, DysfCEN2, and DysfC to membrane lesions (arrow). Dysf accumulates at the site of lesion. Vesicular structures are visible at high magnification (insert). Although DysfN and DysfCEN1 do not accumulate in the lesion, there is an increase of DysfCEN2 and DysfC.
(D) Dysf accumulation at the site of damage in a cell with a low expression level of the fusion protein.
(E) Purified DysfCEN2-GST (arrowhead) and glutathione S-transferase (GST) proteins on SDS PAGE gel.
(F and G) Protein pull-down experiment with recombinant GST- and His-tagged proteins.
(F) shows an anti-GST stained western blot;
(G) shows the same blot stained with anti penta-His antibody. DysfCEN2-His (97kDa, black arrow) was pulled down by DysfCEN2-GST but not with GST alone or sepharose beads. Lower section shows 20% of His-tagged protein input.Scale bars represent 4 μm (A–D) and 0.4 μm (C insert). See also Figure S2.
Reprinted from Developmental Cell, 22(3), Roostalu, U., and Strähle, U., In Vivo imaging of molecular interactions at damaged sarcolemma, 515-529, Copyright (2012) with permission from Elsevier. Full text @ Dev. Cell