
Image
|
Figure Caption
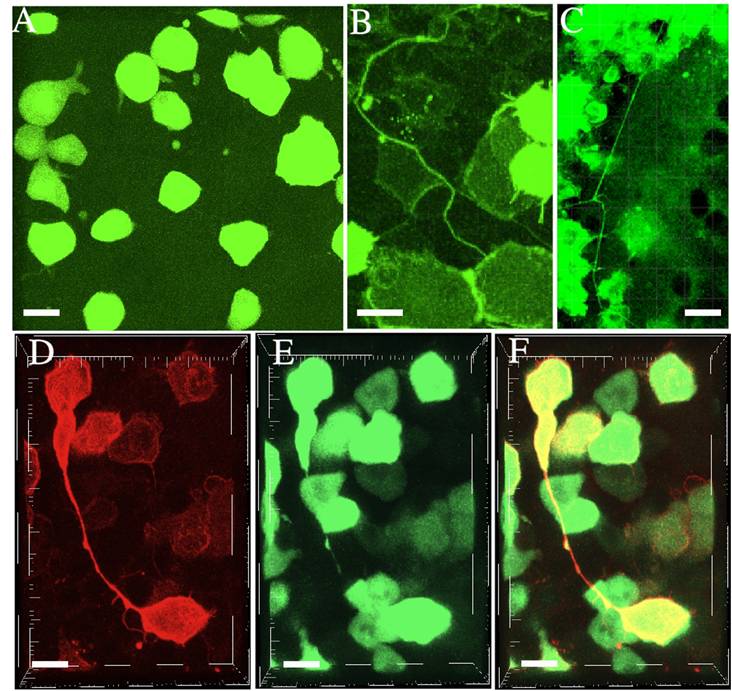
Fig. S1 Intercellular Bridge Properties. (A) Animal pole view of a mosaic zebrafish embryo expressing Dendra2 at the onset of gastrulation. Note that intercellular bridges cannot be visualised even under intense 488 nm illumination of the cytoplasmic fluorescent protein. (B, C) Intercellular bridges visualised at tailbud stage (B) and 3 somites stage (C). (D–F) Intercellular bridge connecting two cells (white arrowheads) labelled with membrane targeted mCherry (D), EGFP-β-Actin (E), and overlay (F). Note that EGFP-β-Actin is partially present inside the intercellular bridge. Scale bar: 20 μm.
Acknowledgments
This image is the copyrighted work of the attributed author or publisher, and
ZFIN has permission only to display this image to its users.
Additional permissions should be obtained from the applicable author or publisher of the image.
Full text @ PLoS One