
|
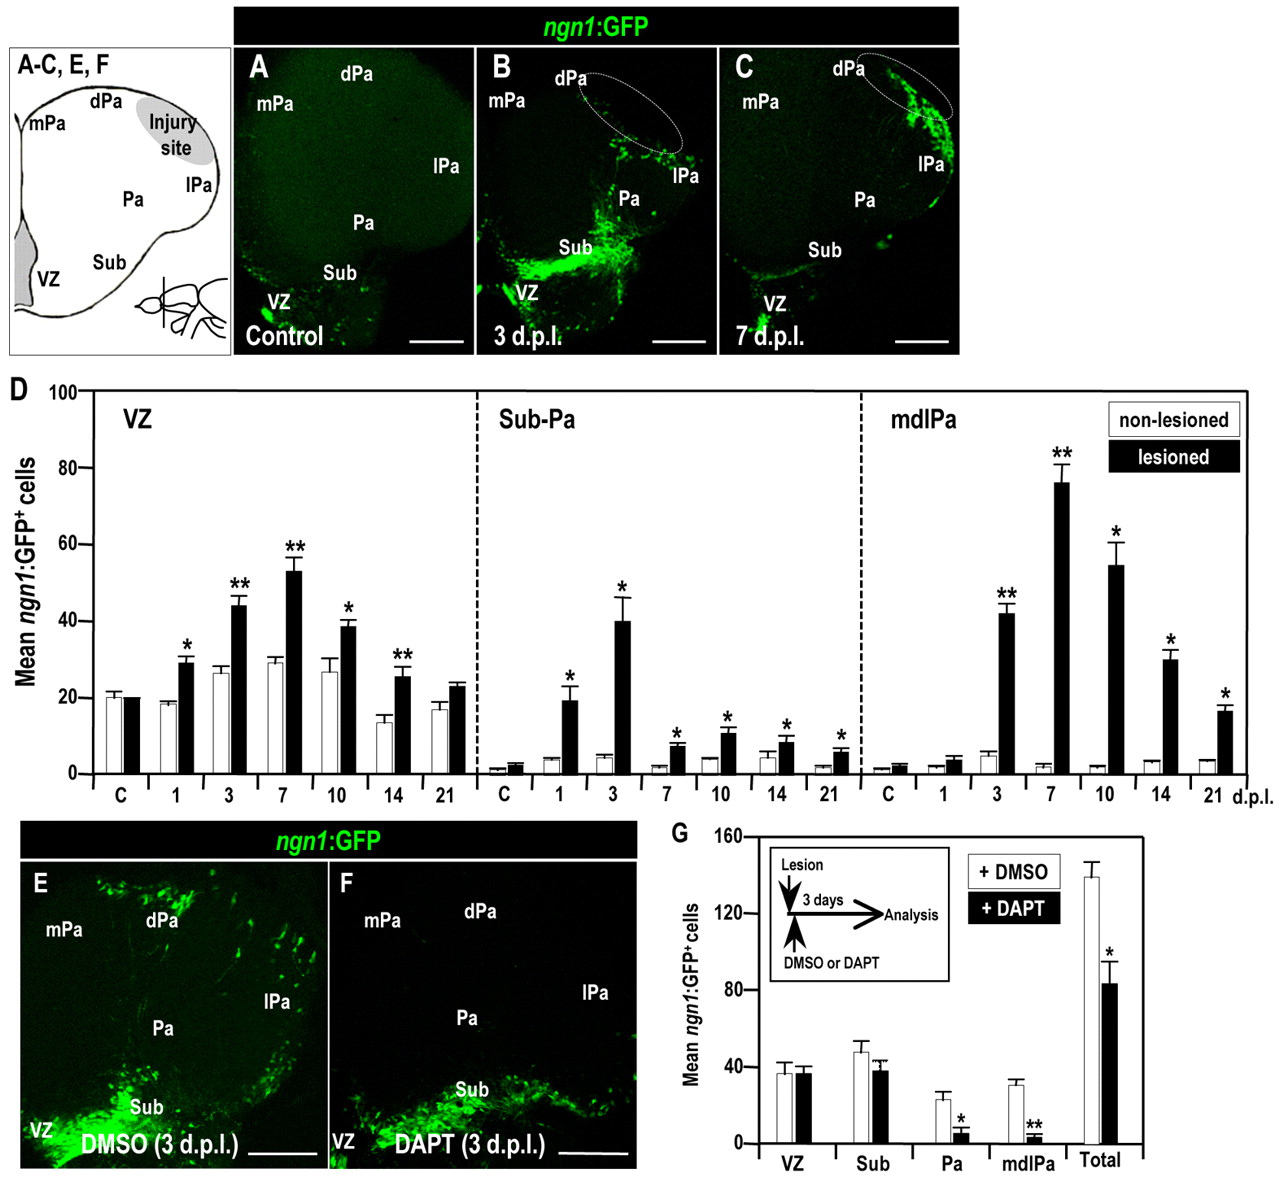
Fig. 5 Distribution of neuronal precursor cells in the injured adult zebrafish telencephalon. (A–C,E,F) Distribution of GFP-positive cells in the lesioned brain of adult Tg(ngn1:gfp) fish (coronal views, dorsal up). (A) Control; (B) 3 dpl; (C) 7 dpl; (E) 3 dpl treated with DMSO; (F) 3 dpl treated with DAPT. White dotted circles indicate the injury site. VZ, ventricular zone; Sub, subpallium; Pa, pallium; mPa, medial pallium; dPa, dorsal pallium; lPa, lateral pallium. Scale bars: 100 μm. (D,G) Histograms showing the GFP-positive cell counts in the VZ, in the subpallium (Sub) and pallium (Pa), and in the medial-dorsal-lateral domain of the telencephalic pallium (mdlPa) in the injured brains of adult Tg(ngn1:gfp) fish, with (D) no treatment, and (G) DMSO or DAPT treatment. Student’s t-test was used to determine significant differences in expression. Error bars represent s.e.m. *P<0.05, **P<0.01.