
|
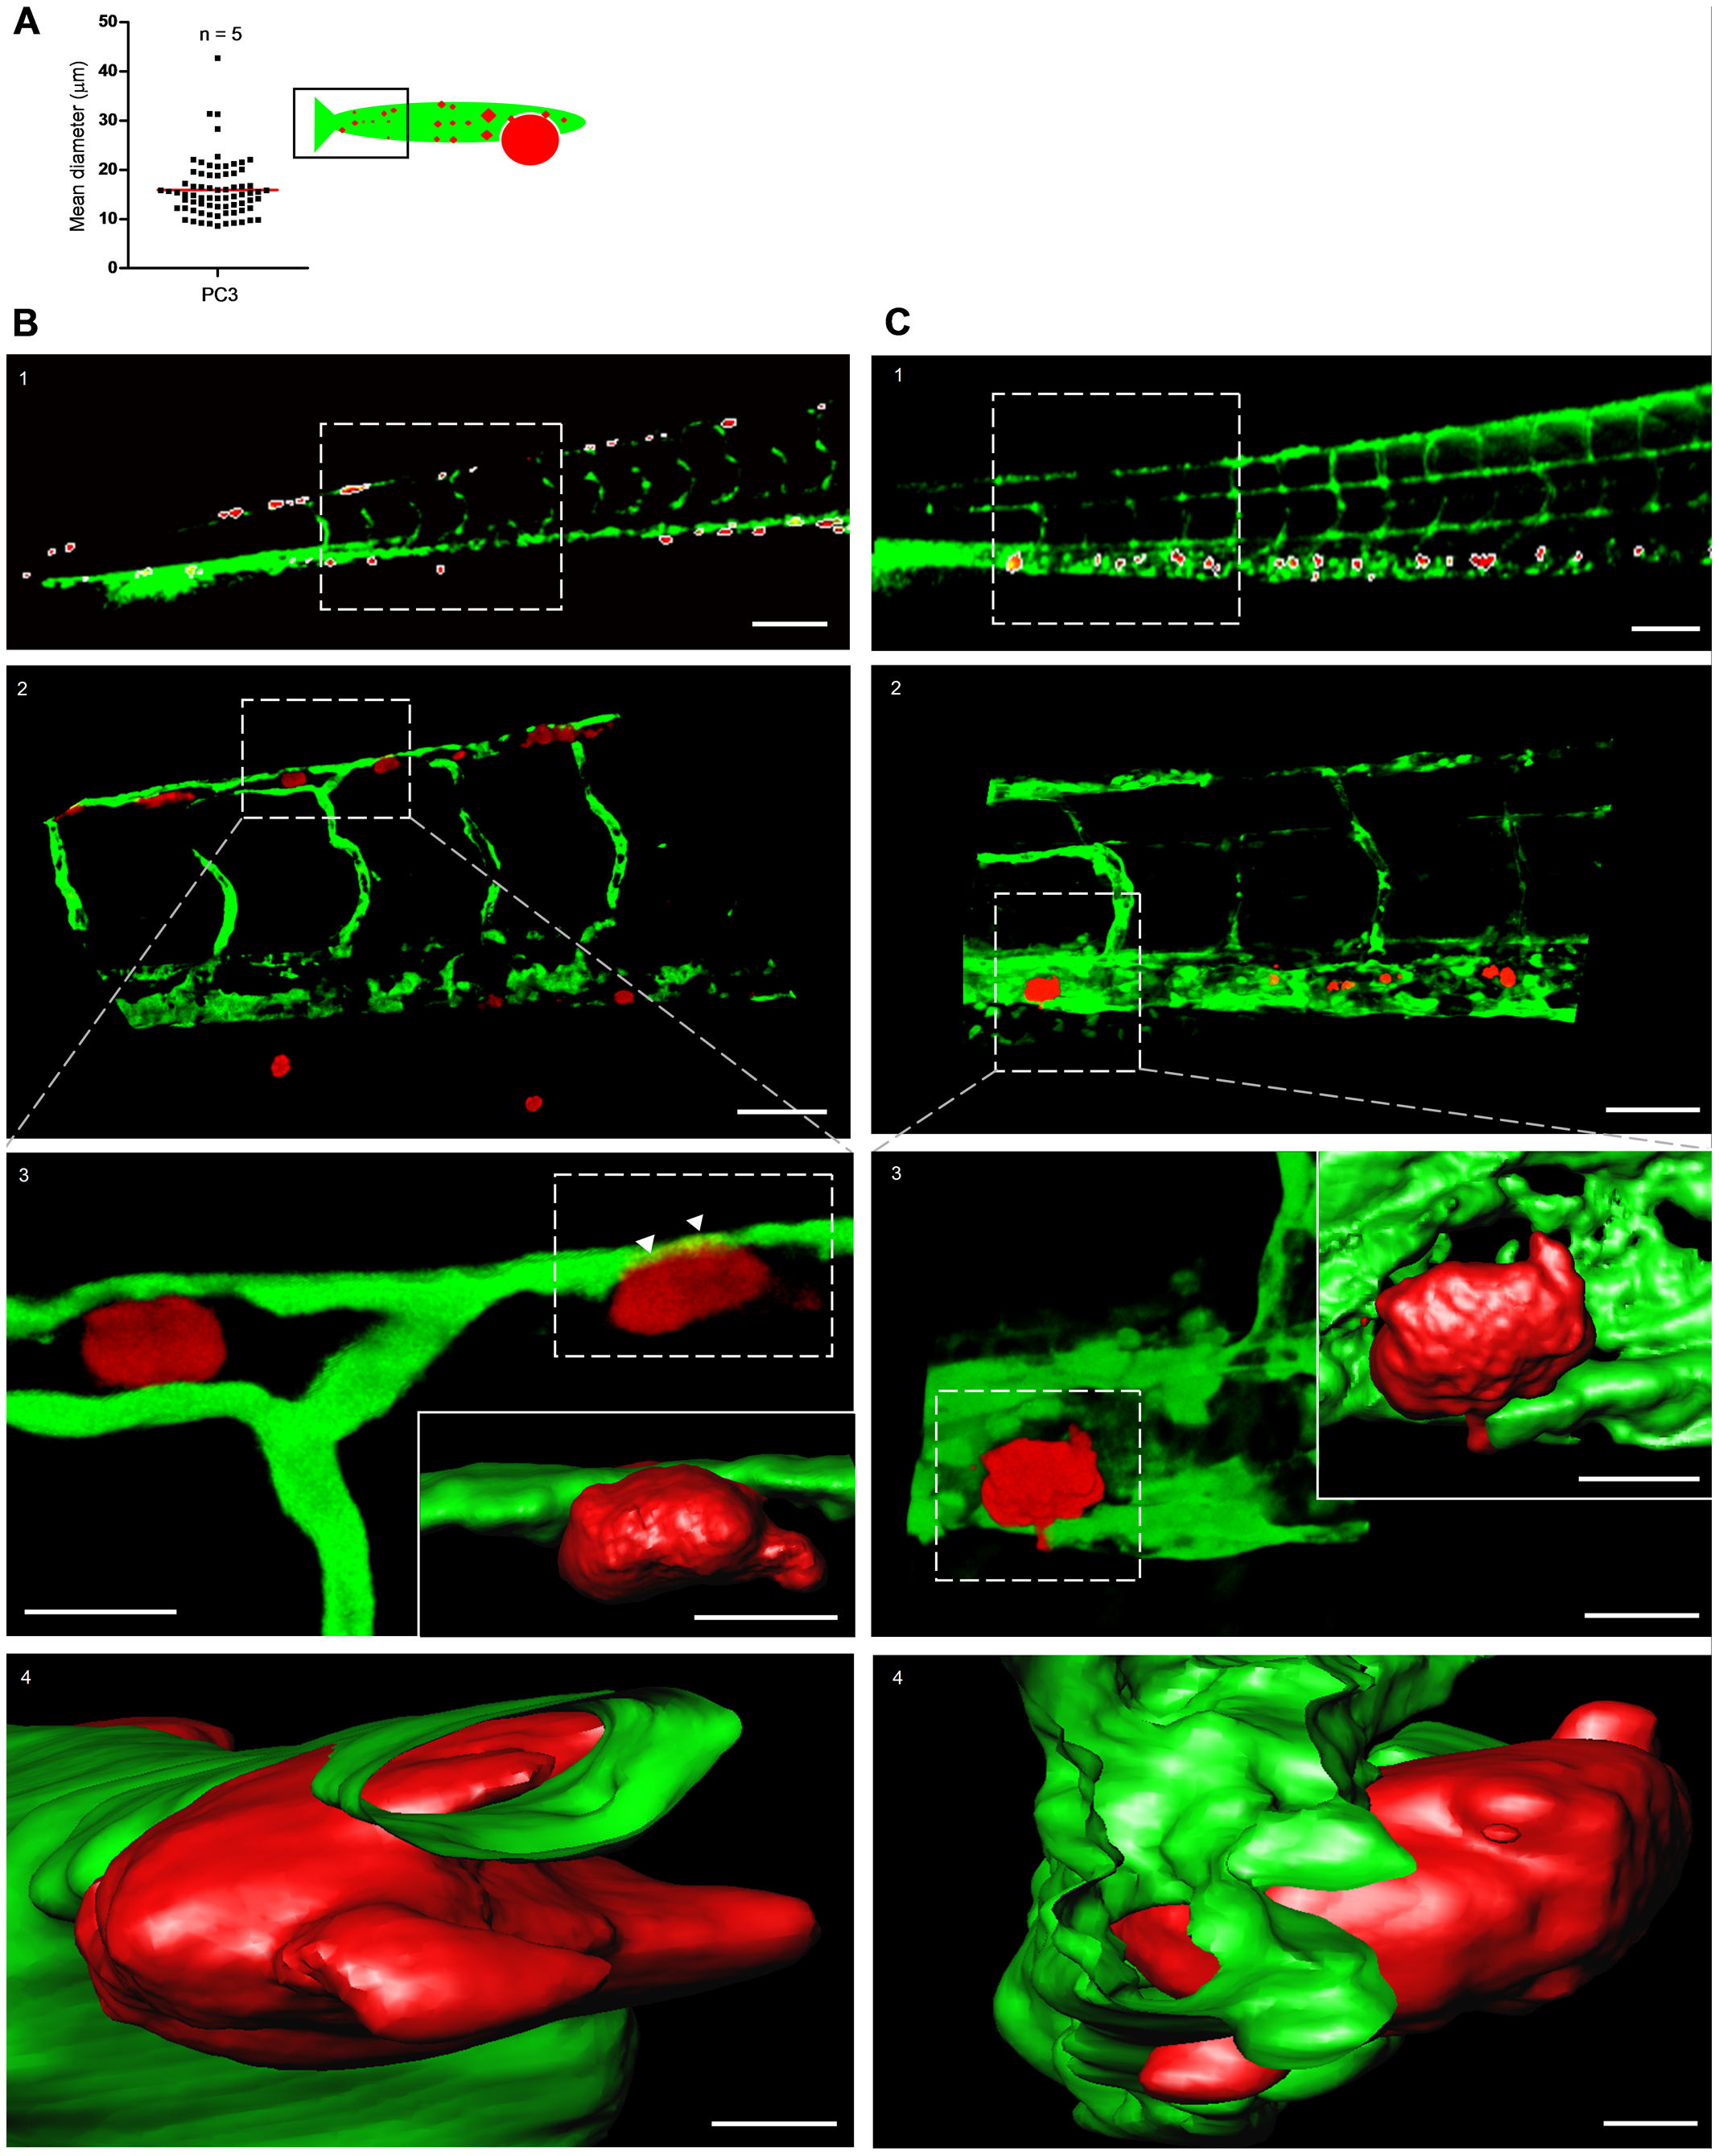
Fig. 5
Characterization of tumor cell foci identified by macro using high-resolution imaging.
(A) Quantification of the mean diameter of macro-identified tumor cell foci from the tail region of PC3-injected embryos. Data obtained from 5 embryos. (B) High resolution imaging of CM-DiI-labeled PC3 tumor cell foci. (B1) Macro-identified PC3 tumor cell foci. (B2) Zoom-in on area indicated in B1 shows tumor cells in association with host vasculature. (B3 and B4) Three dimensional reconstruction and surface rendering of area in insert of B2; arrowheads point to tumor cell partly inside distal longitudinal anastomotic vessel (Video S2 and S3). (C) High resolution imaging of PC3-mCherry tumor cell foci. C1–4, as B1–4 for PC3-mCherry. Scale bar is 100 µm in B1 and C1; 50 μm in B2 and C2; 15 μm in B3 and C3; 10 μm in insets in B3 and C3; 5 μm in B4 and C4.