
|
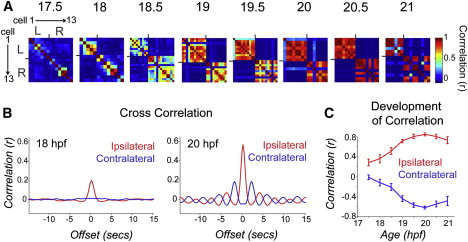
Fig. 2
Pairwise Cell Relationships Progress from Independent to Ipsilaterally Correlated and Contralaterally Anticorrelated during a Short Period of Development (A) Correlation matrices of single-cell traces through the development of an example embryo. Each pixel represents a pairwise comparison between two cells, with high correlation values in red and perfect autocorrelation along the diagonal. Cells are sorted left to right and top to bottom as shown for 17.5 hpf. Ticks mark border between left and right cord and bound a high degree of ipsilateral correlation observed at later time points. (B) Cross-correlation shows a strengthening of ipsilateral coupling between 18 and 20 hpf and acquisition of oscillatory rhythm by 20 hpf. Cross-correlation was calculated by averaging time-shifted correlation data for all ipsilateral and contralateral cell pairs in individual movies, pooled across nine different fish. (C) Average pairwise correlations for synchronous events comparing ipsilateral and contralateral cell pairs from individual time-lapse movies acquired from fish ages 17.5 to 21 hpf and pooled across fish. We observed a significant difference between ipsilateral correlations in younger versus older embryos (18 hpf, r = 0.272 ± 0.082; 20 hpf, r = 0.761 ± 0.031; p < 10-3, paired Student′s t test; n = 9 fish) and a significant increase in the anticorrelation of contralateral cells (18 hpf, r = -0.207 ± 0.067; 20 hpf, r = -0.710 ± 0.028; p = < 10-3, paired Student′s t test; n = 9 fish). n = 9 fish for 18–21 hpf; n = 4 fish at 17.5 hpf. Error bars = SEM. See also Figure S2.