
|
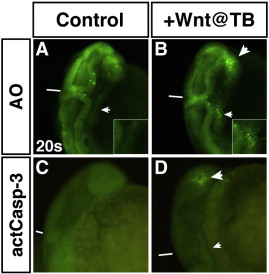
Fig. 6
Increased Wnt signaling at the TB stage causes cell death independent of Caspase-3 activation. (A,C) HCSEs. (B,D) GFP + sibling embryos. (A,B) Embryos at 20 s with AO staining to detect dying cells. There is increased cell death in the LPM at 20 s after increasing Wnt signaling at TB (B; small arrowhead and inset) compared to HCSEs (A; arrow and inset). Significant cell death was also observed in the anterior neural tissue (large arrowhead in B). (C,D) Embryos at 20 s with whole mount immunohistochemical analysis of activated Caspase-3. (D) Activated Caspase-3 is not detected in the LPM where AO staining is observed at 20 s after increasing Wnt signaling at the TB stage (small arrowhead). However, there is substantial activated Caspase-3 detected in the anterior neural tissues (large arrowhead), which is also observed with AO staining (B). Views in A and B are dorso-lateral. Views C and D are lateral. Lines in A–D indicate the position of the midbrain–hindbrain boundary. CPs/CMs are located immediately posterior to this boundary in the LPM.
Reprinted from Developmental Biology, 361(2), Dohn, T.E., and Waxman, J.S., Distinct phases of Wnt/β-catenin signaling direct cardiomyocyte formation in zebrafish, 364-76, Copyright (2012) with permission from Elsevier. Full text @ Dev. Biol.