
Image
|
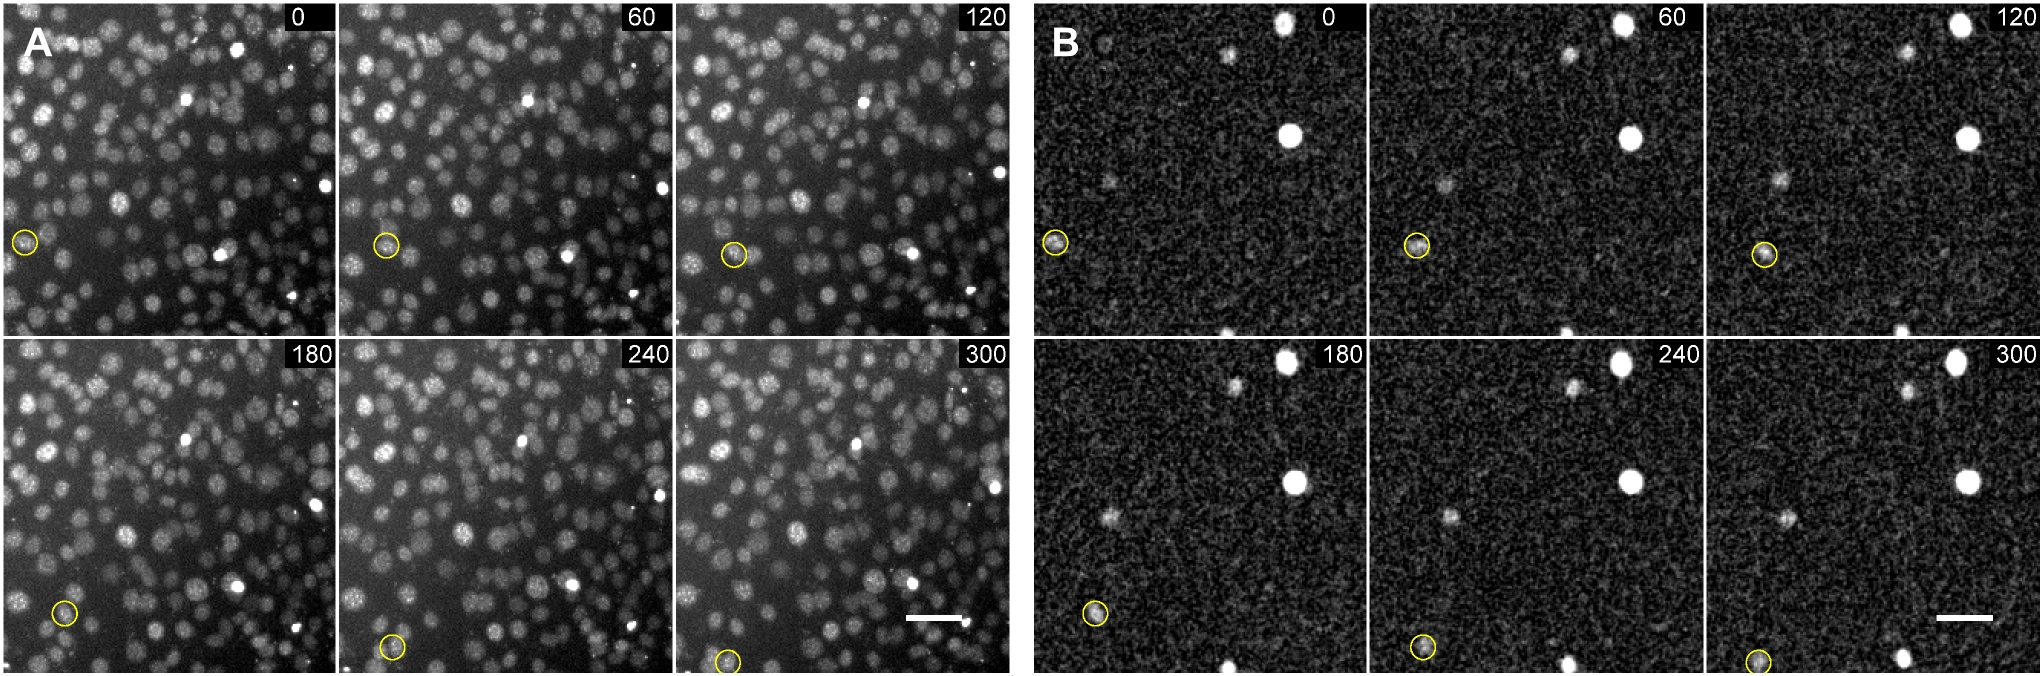
Figure Caption
Fig. S2
Example of C2C12 cell motion.
The highlighted cell has been tracked through multiple frames. Scale bar is 50 microns. Time is displayed in minutes. A) Hoechst channel B) GFP Channel.
Acknowledgments
This image is the copyrighted work of the attributed author or publisher, and
ZFIN has permission only to display this image to its users.
Additional permissions should be obtained from the applicable author or publisher of the image.
Full text @ PLoS One