
Fig. 5
- ID
- ZDB-IMAGE-111220-13
- Genes
- Publication
- Kimmel et al., 2011 - Requirement for Pdx1 in specification of latent endocrine progenitors in zebrafish
- All Figures
- Figures for Kimmel et al., 2011
|
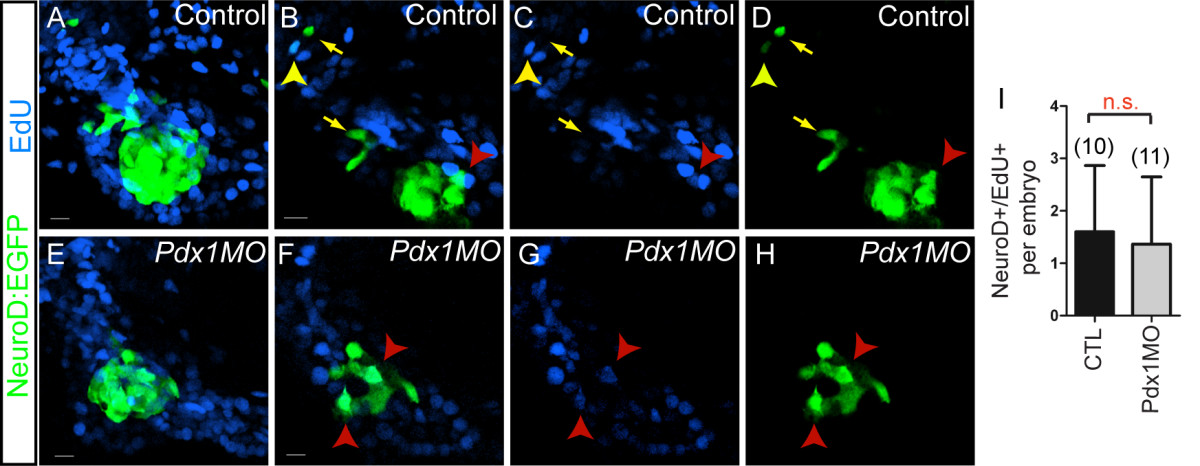
Fig. 5 Contribution of cell proliferation to late endocrine cell expansion. TgBAC(NeuroD:EGFP)nl1 embryos incubated with EdU from 28 to 76 h post fertilization (hpf), followed by EdU detection and green fluorescent protein (GFP) antibody staining. (A, E) Confocal projections and single plane views (B-D, F-H), showing pancreatic region of control (A-D), and pdx1 morphant (E-H) embryos. (B-D) In control embryos, EdU/NeuroD:enhanced green fluorescent protein (EGFP) colabeled cells are located at the periphery of the islet (red arrowhead) and in the region of the extrapancreatic duct (EPD) (yellow arrowhead). Most islet cells are EdU- (C compared to D) and additional EdU-/NeuroD:EGFP+ cells are found along the EPD (yellow arrows). (F-H) In pdx1 morphants, few EdU/NeuroD:EGFP colabeled cells are found within the islet (red arrowhead). (I) Quantitation of EdU/NeuroD:EGFP cells per embryo in wild-type and pdx1 morphant embryos, showing mean and standard deviation. Scale bar = 10 μm. NS, not significant; P > 0.05 as determined by unpaired t test.