
Fig. 2
- ID
- ZDB-IMAGE-111215-18
- Genes
- Publication
- Nguyen et al., 2011 - A high level of liver-specific expression of oncogenic KrasV12 drives robust liver tumorigenesis in transgenic zebrafish
- All Figures
- Figures for Nguyen et al., 2011
|
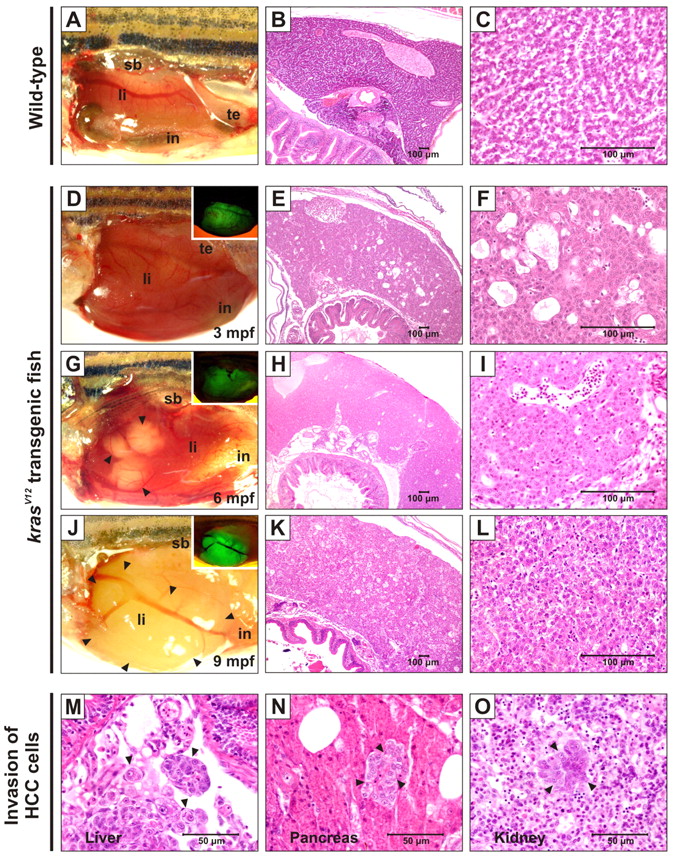
Fig. 2 Liver tumor progression in krasV12 transgenic zebrafish. Abbreviations: in, intestine; li, liver; sb, swimbladder; te, testis. (A–C) Gross morphology and histology of WT zebrafish showing normal liver and tissue architecture. (D–L) Gross morphology and histology of F2/II krasV12 zebrafish. (D,G,I) Brightfield and fluorescence (insets) images displaying the progressive stages of liver tumors at 3, 6 and 9 mpf. Various tumor protrusions are indicated by arrowheads. Corresponding histological sections are shown in the same rows. Livers were observed at 3 mpf (D) and histological appearance revealed multifocal mild-to-moderate cystic degeneration (spongiosis hepatis) and diffused moderate hepatocellular hyperplasia (E,F). Many white nodules were developed in transgenic liver at 6 mpf (G) and their histology indicated hepatocellular adenoma containing vacuolated clear cells with increased cytoplasmic glycogen (H,I). Malignant tumors were visibly observed at around 9 mpf (J) and histological analysis confirmed that the tumor was HCC grade II–III (K,L). (M–O) Invasion of HCC cells (indicated by arrowheads) into blood vessels (M) and adjacent tissues, namely pancreas (N) and kidney (O).