
Fig. 6
- ID
- ZDB-IMAGE-111209-5
- Publication
- Gill et al., 2010 - Enforced expression of simian virus 40 large T-antigen leads to testicular germ cell tumors in zebrafish
- All Figures
- Figures for Gill et al., 2010
|
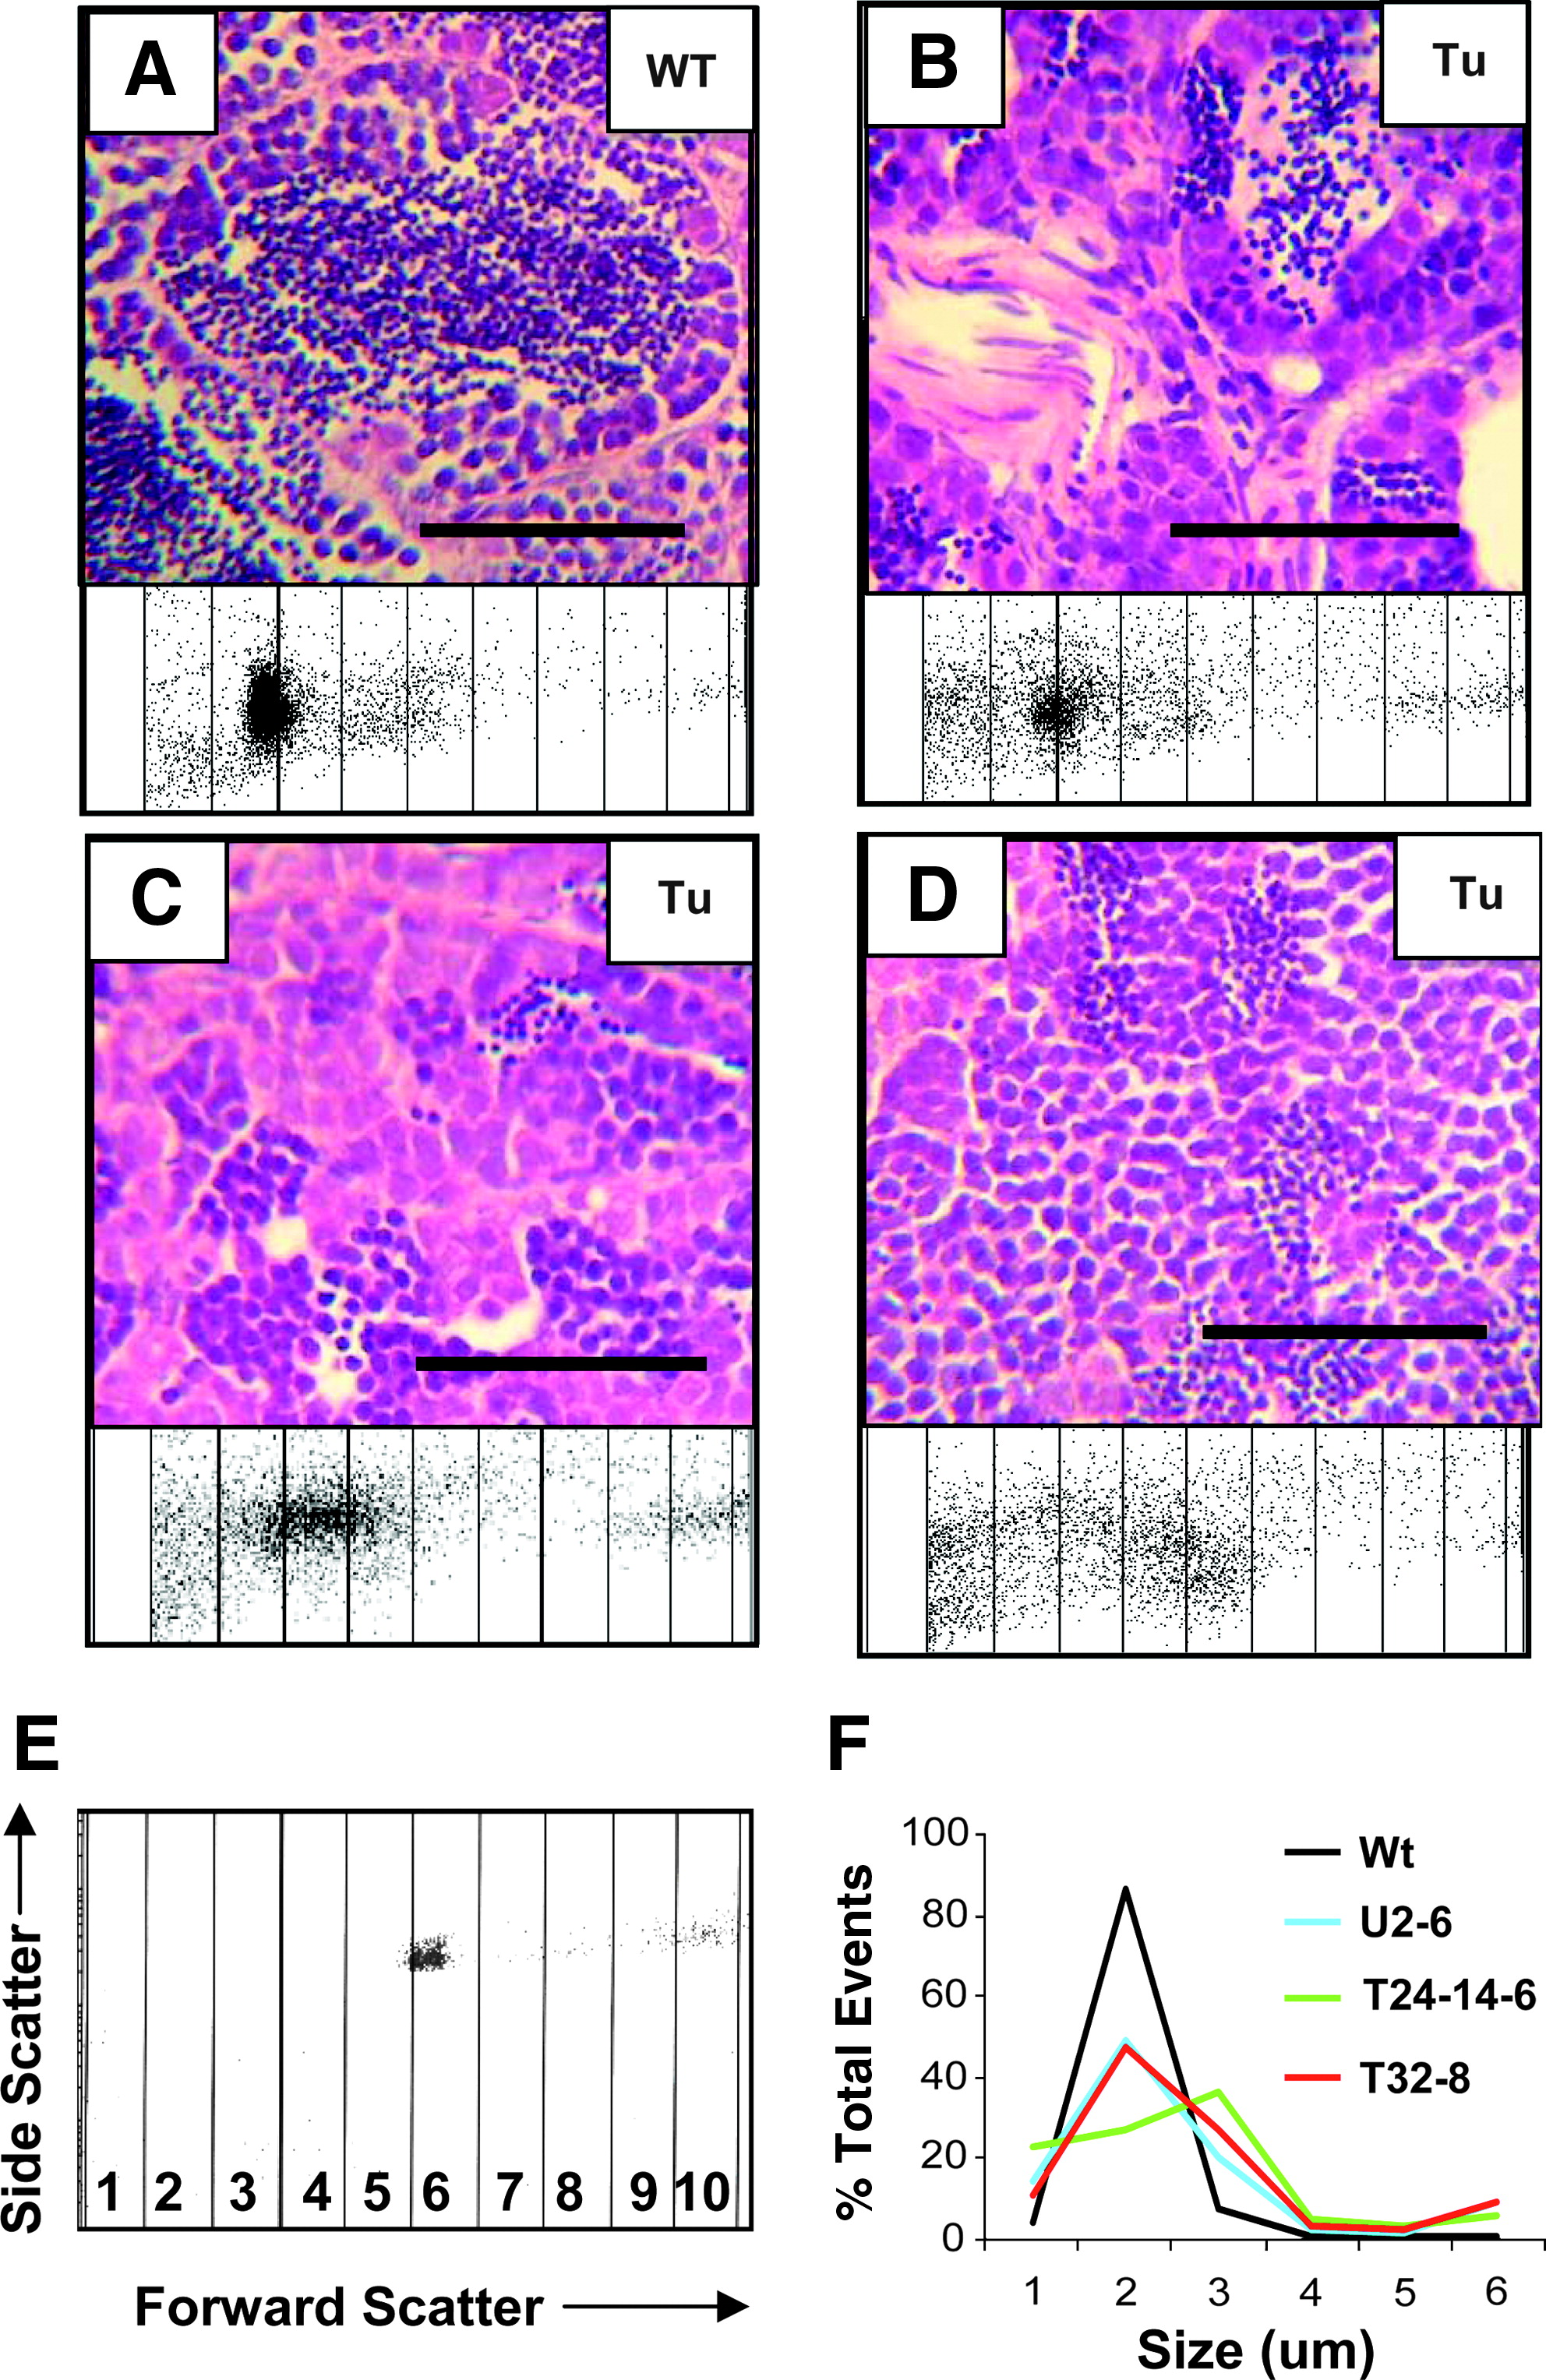
Fig. 6 FACS analysis of TGCT and WT testes. (A–D) Hematoxylin and eosin staining compared to FACS forward scatter, divided into 1 μm segments. (A) WT testes, (B) a TGCT from a Tg(flck:scl fish (No. U2-6), (C) a TGCT from a Tg(flck:TAg) fish (No. T32-8), and (D) a TGCT from a Tg(flck:TAg) fish (No. T24-14-6). Scale bar is 50 μm. (E) Calibration using 6.0–6.4 μm beads. Y-axis (side scatter) and X-axis (forward scatter) are the same for all FACS plots. (F) Percent events versus size as estimated by forward scatter and calibration beads from the TGCT shown in panels (A–D). Note that over 80% of WT events are 2–3 μm in size, consistent with spermatids, whereas the TGCTs have increased numbers of events >3 μm, consistent with spermatocytes and spermatogonia.