
Fig. 4
- ID
- ZDB-IMAGE-111117-4
- Publication
- Seger et al., 2011 - Analysis of Pax7 expressing myogenic cells in zebrafish muscle development, injury, and models of disease
- All Figures
- Figures for Seger et al., 2011
|
Fig. 4
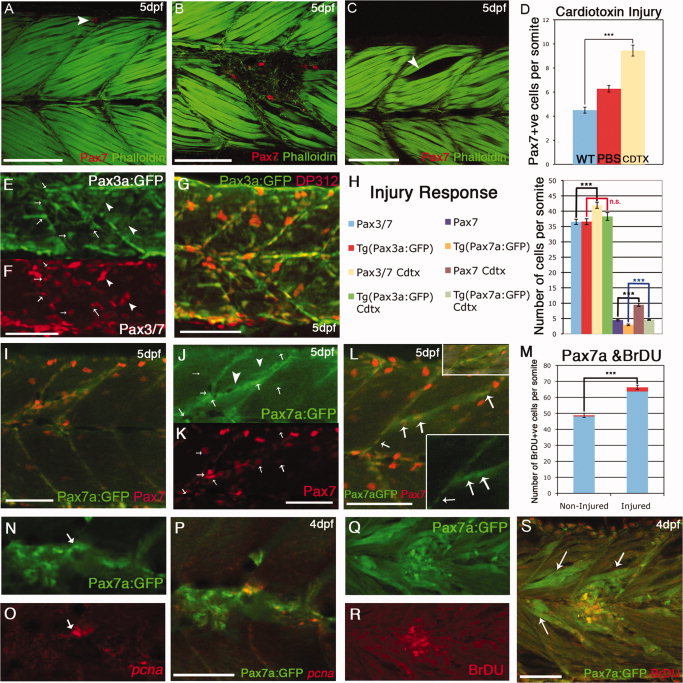
Behavior of Pax7+ve cells in response to cardiotoxin-induced injury. A: By 5 days postfertilization (dpf), Pax7+ve cells are relatively scarce in individual somites of uninjured larvae: in this image a single labeled cell (red: αPax7) is located at the dorsal extreme (arrow). B: Cardiotoxin injected larvae at 5 days postfertilization (dpf): several Pax7+ve cells accumulate at the site of injury. C: Control injection with phosphate buffered saline (PBS) creates a gap in the myotome (arrow) but no accumulation of Pax7+ve cells. D: numbers of Pax7+ve cells accumulated at the site of injury within 24–48 hr of injection into the somite with 0.3mg/ml Cardiotoxin (yellow bar) compared with noninjured (blue bar); injection with PBS alone resulted in fewer Pax7+ve cells present (red bar). Numbers based on analysis of three somites in four to seven animals, error bars show standard error. Asterisks: P < 0.001. Counts include only weakly stained Pax7+ve cells and exclude intensely stained elongated Pax7+ve xanthophores. E–G: Five dpf injured TgBAC(pax3a:GFP)i150 stained with DP312 (Pax3/Pax7), which labels both GFP+ve cells (arrows) and bright xanthophores (arrowheads). H: Numbers of Pax3+ve and Pax7+ve cells compared with their respective transgenic lines in noninjured and injured backgrounds. The numbers of Pax7+ve cells counted in fixed specimens was significantly higher in injured vs. noninjured somites in TgBAC(pax7a:GFP)i131 embryos and Pax7mAb stained embryos, while no significant increase was observed following injury of TgBAC(pax3a:GFP)i150 embryos compared with noninjured TgBAC(pax3a:GFP)i150 embryos. Numbers based on analysis of three somites in four to seven animals, error bars show standard error. Asterisks: P < 0.005. I–K: 5 dpf injured TgBAC(pax7a:GFP)i131 stained with αPax7 mAb (K, red). Individual Pax7+ve cells are positive both for Pax7and pax7a:GFP (arrows, J,K), but up-regulation of GFP is also seen in the injured fibers (arrowheads, J). L: Another example of an injured 5 dpf TgBAC(pax7a:GFP)i131 with small inserts showing the injury site and the GFP channel with individual cells alongside the injured fibers (arrows). M: Number of bromodeoxyuridine-positive (BrDU+ve) nuclei in injured vs. noninjured TgBAC(pax7a:GFP)i131 embryos at 4 dpf. While there is a significant increase of labeled BrDU+ve cells overall, the proportion of BrDU+ve GFP+ve labeled cells is significantly increased in injured vs. noninjured fish (marked in red shading in the graph). Numbers based on analysis of three somites in 4–7 animals, error bars show standard error. Asterisks: P < 0.005. Counts include only weakly expressing GFP+ve cells and exclude intensely expressing elongated Pax7a:GFP xanthophores. N–P: A GFP+ve cell (arrow) in an injured 4 dpf TgBAC(pax7a:GFP)i131(N) expresses pcna mRNA (O, red). Q–S: BrdU labeling (R, red) of GFP+ve cells in TgBAC(pax7a:GFP)i131 (Q) embryos injured at 4 dpf. Note also up-regulation of GFP expression in fibers around the injury site (S, arrows). Scale bar = 50 μm.