
|
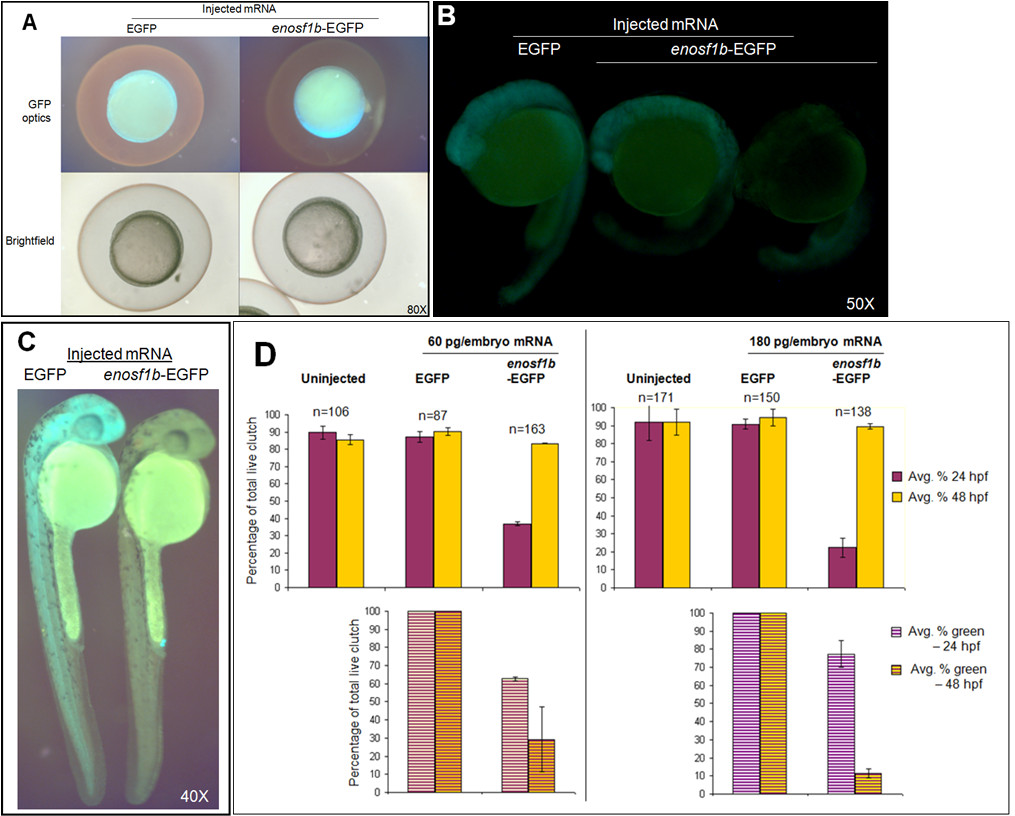
Fig. 4
In vivo expression of enosf1b-EGFP compared to EGFP. A-C: Lateral views of representative embryos injected with in vitro transcribed mRNA encoding enosf1b-EGFP or EGFP. Original magnification for all photomicrographs is in the lower right hand corner of each picture. D: Comparison of the effect of injecting equal doses of enosf1b-EGFP or EGFP mRNA on time embryos reach 24 hpf or 48 hpf developmental stage. Data is average of three independent experiments; "n" values are total of the three experiments. Error bars are standard deviation. Original magnification for all photomicrographs is in the lower right hand corner of each picture.