
|
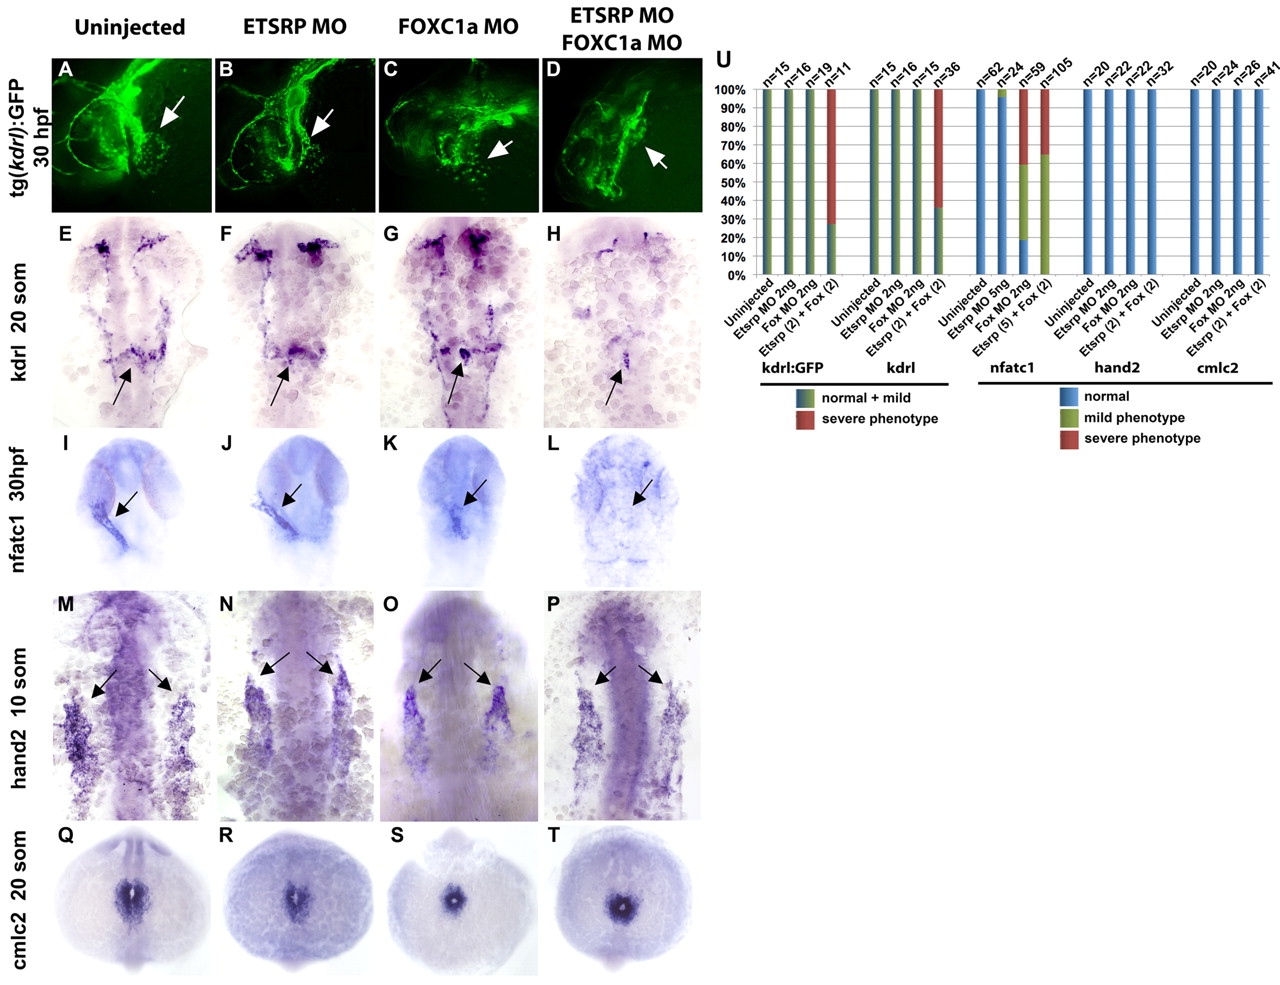
Fig. 8 Simultaneous Foxc1a and Etsrp knockdown affects endocardial but not myocardial development. (A-L) Endocardial markers kdrl:GFP at 30 hpf (A-D, arrows), kdrl at the 20-somite stage (E-H, arrows) and nfatc1 at 30 hpf (I-L, arrows) show no or only a slight reduction in expression in embryos injected with low doses of either 2 ng Etsrp MO (B,F,J) or 2 ng Foxc1a MO (C,G,K) compared with uninjected controls (A,E,I). However, upon simultaneous knockdown of Etsrp and Foxc1a, levels of all of these endocardial markers are severely reduced (D,H,L). (M-T) Myocardial hand2 expression at the 10-somite stage (M-P, arrows show anterior border) and cmlc2 at the 20-somite stage (Q-T) are not significantly affected in 2 ng etsrp MO-injected (N,R), 2 ng Foxc1a MO-injected (O,S) or Etsrp/Foxc1a MO co-injected (P,T) embryos compared with uninjected controls (M,Q). (A-D) Whole-mount fluorescent images of fixed Tg(kdrl:GFP) embryos at 30 hpf, anterior is towards the left, dorsal is upwards. (E-P) Ventral flat-mount view of in situ hybridization analysis, anterior is upwards. (Q-T) Anterodorsal whole-mount view, anterior is upwards. (U) Phenotypic distribution of endocardial kdrl:GFP, kdrl, nfatc1 and myocardial hand2 expression in etsrp, foxc1a and etsrp/foxc1a MO-injected embryos. The blue bars represent no change, whereas the green and red bars indicate mild and severe reduction in endocardial expression, respectively. Note that for kdrl:GFP and kdrl expression, normal or mildly reduced categories are combined and shown in dark green because it was difficult to distinguish the two categories.