
|
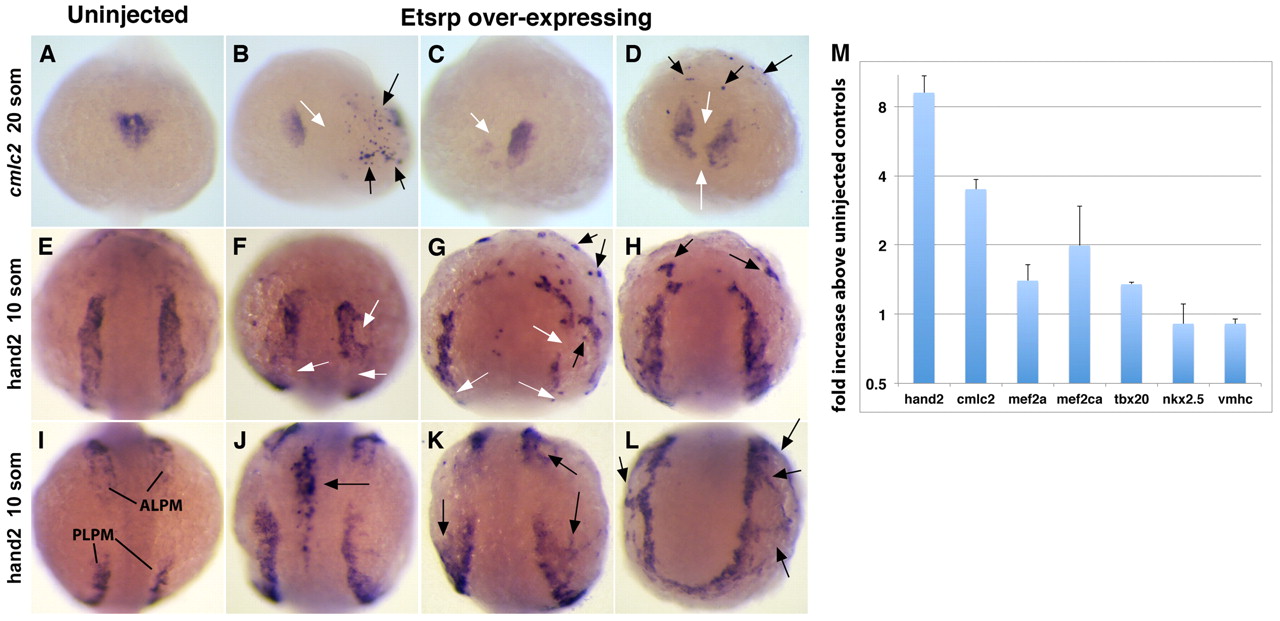
Fig. 5 Etsrp overexpression results in the loss of endogenous myocardial markers and the induction of ectopic myocardium. cmlc2 (A-D) and hand2 (E-L) expression analysis in uninjected (A,E,I) and etsrp DNA-injected (B-D,F-H,J-L) embryos. (A-D) Etsrp-overexpressing embryos exhibit fusion defects, missing cells (B-D, white arrows) and ectopic cmlc2 expression at the 20-somite stage (B,D, black arrows). (E-L) At the 10-somite stage, Etsrp overexpression results in both disruption of endogenous hand2 expression (F,G, white arrows) and induction of ectopic expression (black arrows, G,H,J-L). (A-H) Anterodorsal whole-mount view, anterior is upwards; (I-K) mid-dorsal view, anterior is upwards; (L) posterior view, dorsal is upwards. (M) Normalized ratio of myocardial marker expression in etsrp DNA-injected embryos versus wild-type embryos, as analyzed by qPCR. y-axis is shown in [log]2 scale. Data are mean±s.e.m.