
|
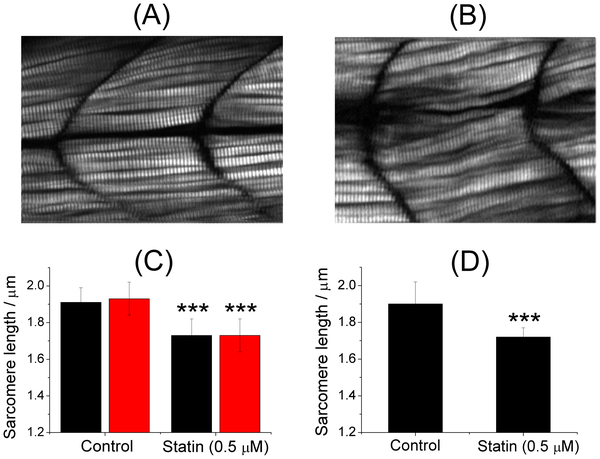
Fig. 3
Structural modification of zebrafish muscles induced on treatment with statin.
(A) A representative SHG image of the control (an untreated zebrafish larva, 72 hpf). (B) A representative SHG image of a zebrafish larva (72 hpf) subject to treatment with statin (50 μM) for 12 h. Image size: 140 μm (w)×100 μm (h). (C) Effect of statin treatment on zebrafish with underdeveloped sarcomeres. The zebrafish was subject to a treatment of statin (0.5 μM) at 24 hpf for 12 h, and imaged at 36 hpf (black: somites 5~8; red: somites 21–24). (D) Effect of statin treatment on zebrafish with fully developed sarcomeres. The zebrafish was subject to a treatment of the same dosage at 72 hpf for 12 h, and the image was taken at 84 hpf (head, somites 5~8).