
|
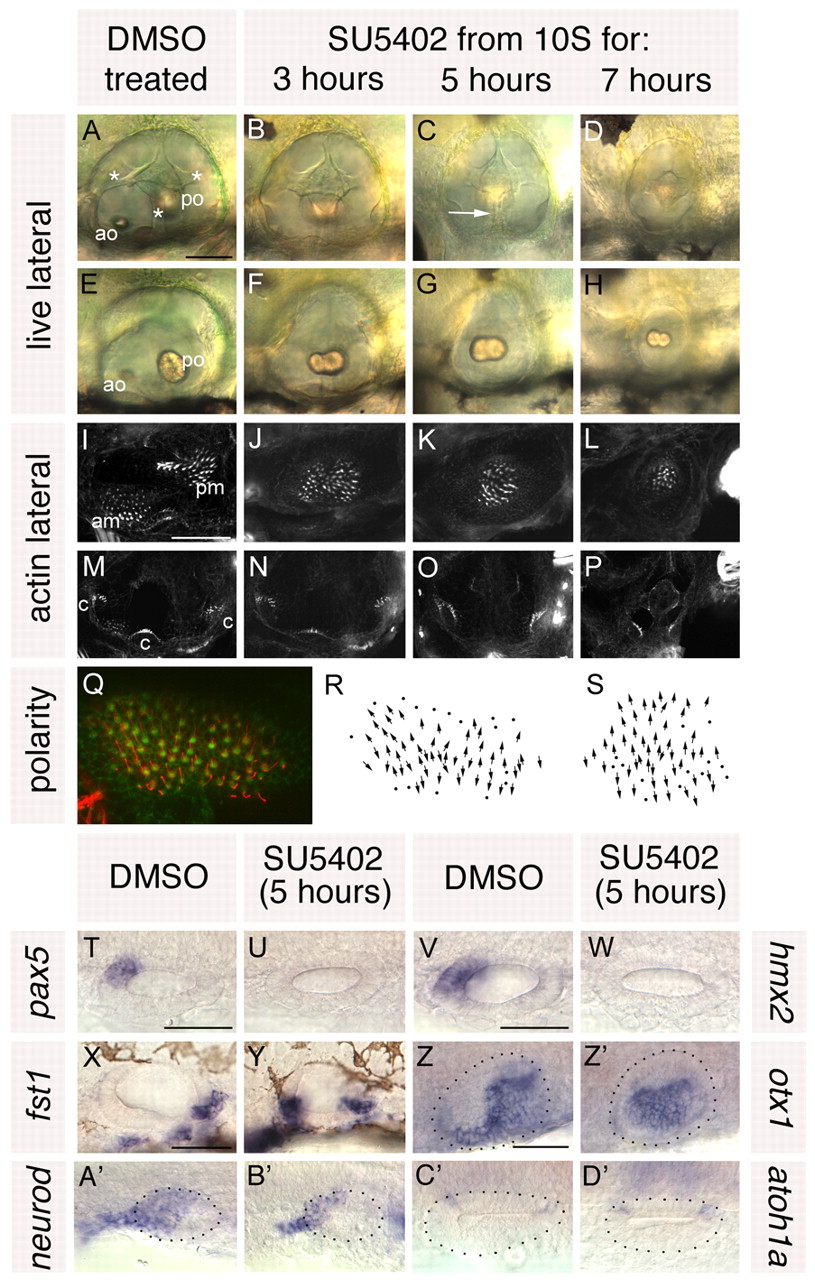
Fig. 3 Treatment with SU5402 from 10 to 20S leads to a complete loss of anterior otic structures and a mirror image duplication of posterior otic structures. (A-H) Live ears of 84 hpf zebrafish embryos treated with 10 μM SU5402 and DMSO-treated controls. (I-P) Confocal z-stacks of 84 hpf SU5402-treated and control ears stained with FITC-phalloidin to mark sensory hair cells. (I-L) Medial focal planes showing the maculae. (M-P) Lateral focal planes showing the cristae. (Q) The macula of an 86 hpf SU5402-treated embryo stained with anti-acetylated tubulin antibody (kinocilia; red) and FITC-phalloidin (stereocilia; green). (R) Hair cell polarity map obtained from the macula shown in Q. (S) Polarity map obtained from a further SU5402-treated specimen. (T-W) In situ hybridisation to the anterior otic markers pax5 (T,U) and hmx2 (V,W). (X-Z′) In situ hybridisation to the posterior otic markers fst1 (X,Y) and otx1 (Z,Z′). (A′,B′) In situ hybridisation to neurod, which marks the statoacoustic ganglion. (C′,D′) In situ hybridisation to atoh1a, which marks the first hair cells. A-P,X,Y: Lateral views; anterior to left, dorsal to top. T-W,Z-D′: Dorsal views; anterior to left, medial to top. am, anterior macula; ao, anterior otolith; c, cristae; pm, posterior macula; po, posterior otolith. Asterisks in A indicate semicircular canal pillars; arrow in C indicates reduced lateral semicircular canal pillar. Dots in Z-D′ delineate the otic vesicle. Scale bars: 50 μm.