
Image
|
Figure Caption
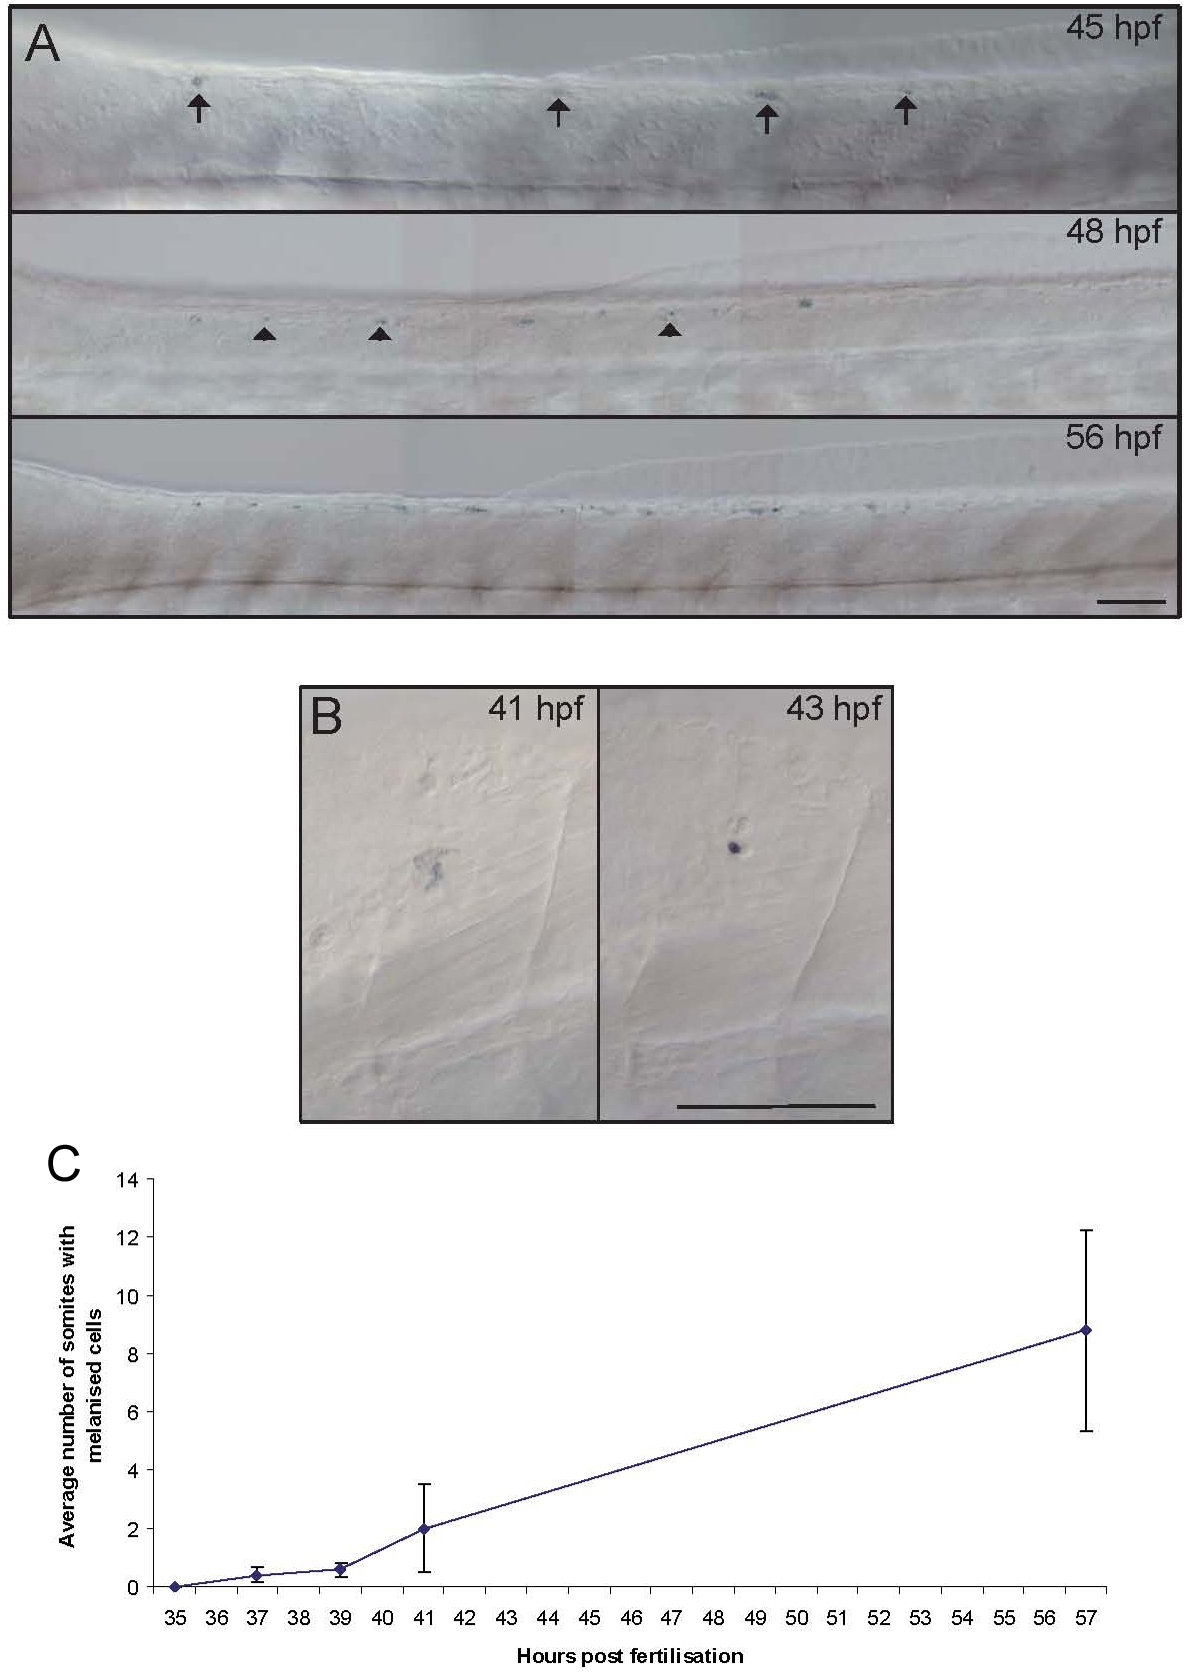
Fig. S2
Residual melanised cells in sox10 mutants appear late and then increase with time. A) Photographs of dorsal trunk of a single embryo showing dynamic changes in residual melanised cells. Note how initially many cells show diffuse melanin (arrows) and how new melanised cells appear with time (arrowheads). B) Photographs of single melanised cell at consecutive time-points, showing change from diffuse melanin (41 hpf) to tiny, dense spot (43 hpf). C) Graphical plot of mean±s.e. number of segments containing residual melanised cells from a typical series of embryos (n = 19).
Acknowledgments
This image is the copyrighted work of the attributed author or publisher, and
ZFIN has permission only to display this image to its users.
Additional permissions should be obtained from the applicable author or publisher of the image.
Full text @ PLoS Genet.