
|
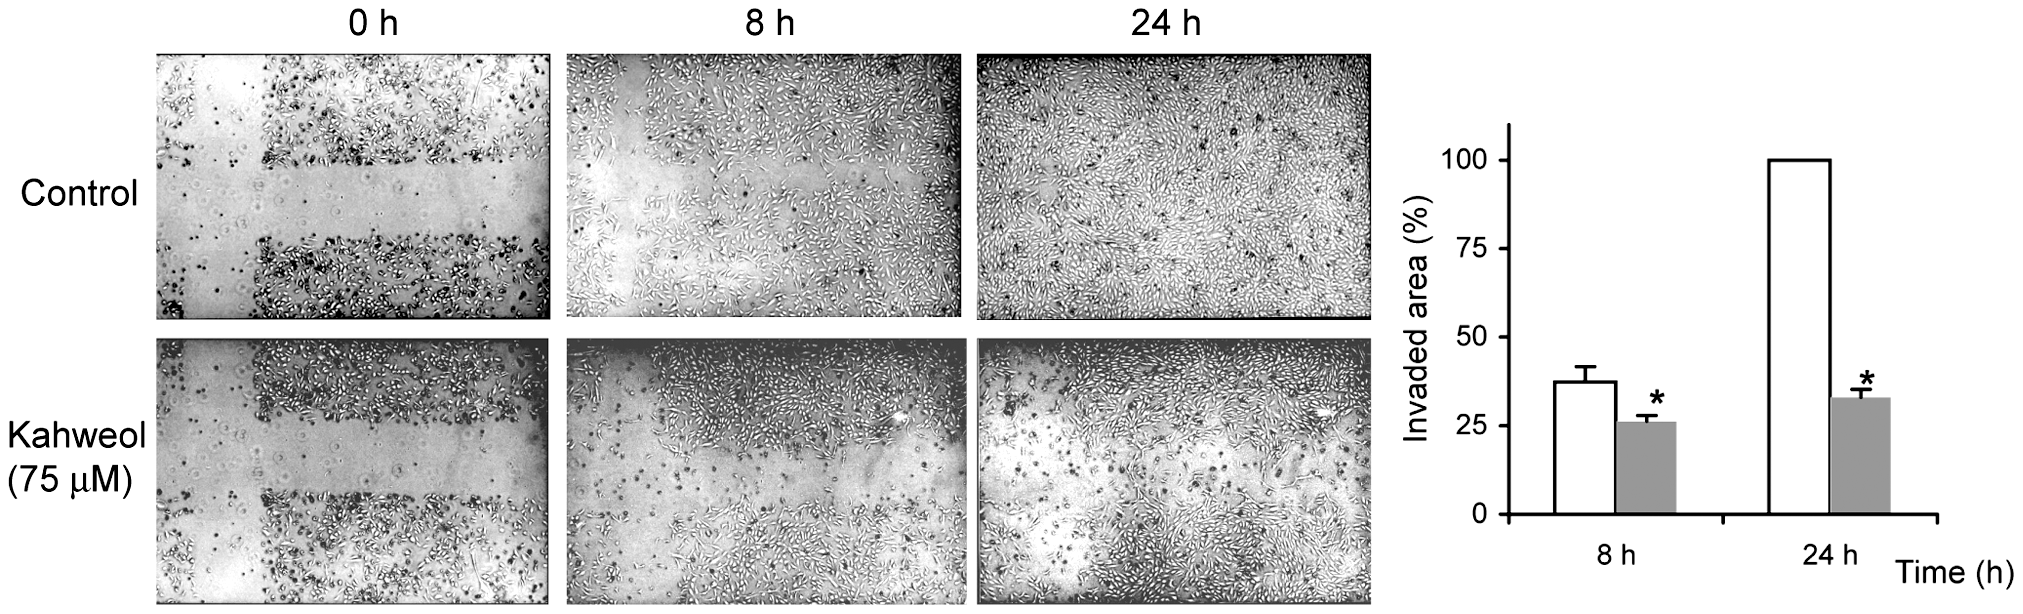
Fig. 6
Kahweol inhibits endothelial cell migration.
Photographs were taken on untreated (control) and 75 μM kahweol-treated HUVEC cells at 0, 8 and 24 h after “wounding”. Data are representative of, at least, three independent experiments. At the right, the counting of HUVEC migration into the “wounded” area at 8 and 24 h after “wounding” is depicted. Data are given as percentages of re-occupied “wounded” area and they are means±S.D. of three different experiments. White bars are control values and grey bars correspond to treatments. *Statistically significant (p<0.01) as compared to control values, according to a two-tailed Student′s t-test.