
|
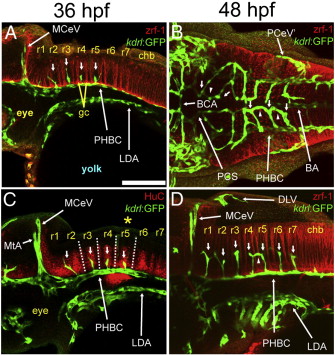
Fig. 4
. Relationship between the CtAs and rhombomeres. A-D, Maximum intensity confocal projections of immuno-fluorescently stained embryos carrying the endothelial reporter Tg(kdrl:GFP)1a116. Endothelium, green (GFP). Rhombomere boundaries in A, B, D; red (zrf-1). Differentiated neurons in C; red (HuC). Ages (hpf) indicated above. Abbreviations (see Table 1): vasculature, white (apostrophe, right side); neuroepithelium, yellow. Small white arrows, CtAs. Small white arrowheads, ipsilateral CtA fusions. Yellow asterisk, r5 GFP-positive neuroepithelial signal from the Tg(kdrl:GFP)1a116 reporter. A, C, D, lateral views. Anterior, left. Dorsal, top. B, Dorsal view. Anterior, left. Left side, bottom. Scale bar (A), 100 μm.
Reprinted from Developmental Biology, 357(1), Ulrich, F., Ma, L.H., Baker, R.G., and Torres-Vazquez, J., Neurovascular development in the embryonic zebrafish hindbrain, 134-51, Copyright (2011) with permission from Elsevier. Full text @ Dev. Biol.