
Fig. 2
- ID
- ZDB-IMAGE-110907-2
- Publication
- Lele et al., 2001 - Zebrafish admp is required to restrict the size of the organizer and to promote posterior and ventral development
- All Figures
- Figures for Lele et al., 2001
|
Fig. 2
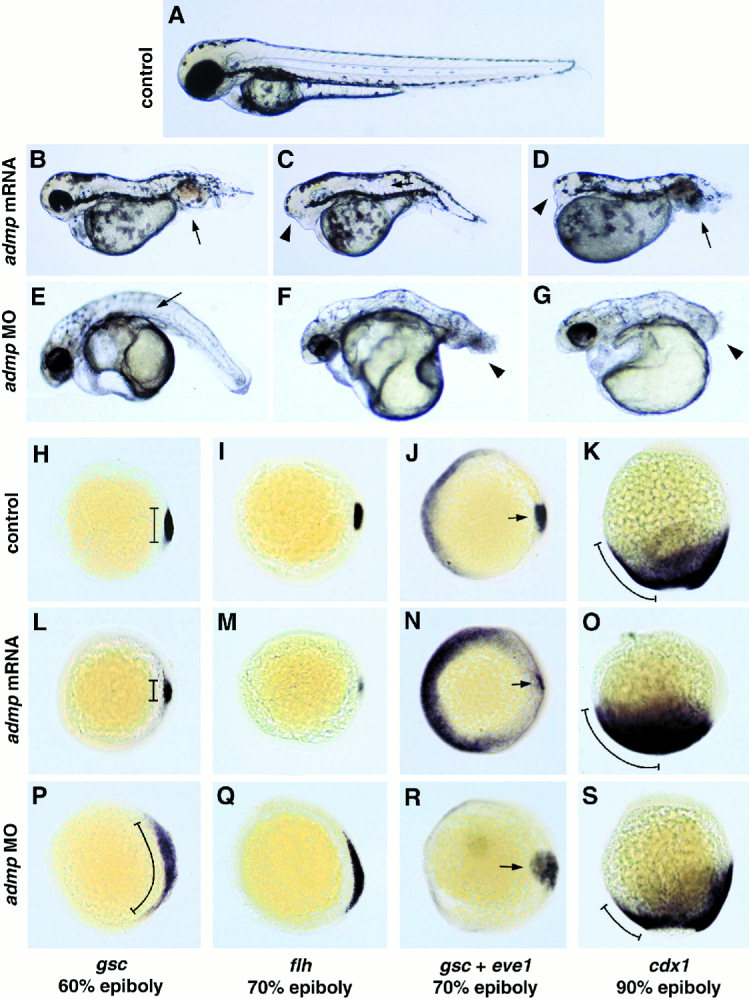
admp overexpression leads to a reduction of the organizer and a ventralization of the embryo; admp knock-down leads to an enlarged organizer and a dorsalization of the embryo. A–G: Live embryos at 60 hr postfertilization (hpf). H–S: Whole-mount in situ hybridizations at indicated stages and with indicated probes. (A,H–K) Un-injected controls; (B–D,L–O) embryos after injection of admp mRNA (50–100 pg/embryo); (E–G,P–S) embryos after injection of admp antisense morpholino oligonucleotide (50–300 pmol/embryo). Arrows in B,D point to enlarged blood islands, a sign of ventralization; arrow in C to U-shaped somites, resulting from the absence of the notochord; arrowheads in C,D to the lost head; arrow in E to the broadened notochord; and arrowheads in F,G to the reduced tail. The shortened axis in admp mRNA-injected embryos (B–D) is due to the partial loss of the dorsal axis, resulting in impaired extension movements, similarly to the situation in dino mutants. H,L,P: gsc, 60% epiboly, animal view, dorsal right. Length of the gsc expression domain along the dorsoventral axis is indicated by bars. I,M,Q: flh, 70% epiboly, vegetal view, dorsal right. J,N,R: gsc (indicated by arrows) and eve1, 70% epiboly, vegetal view, dorsal right. Note that in comparison to P, the gsc expression domain in R has become narrower and thicker, most likely due to dorsal convergence movements of gastrulation. K,O,S: cdx1, 90% epiboly, lateral view, dorsal right. Length of the cdx1 along the animal-vegetal axis on the ventral side of the embryos is indicated by bars.