
Fig. 2
- ID
- ZDB-IMAGE-110816-13
- Genes
- Publication
- Mapp et al., 2010 - Prickle1b mediates interpretation of migratory cues during zebrafish facial branchiomotor neuron migration
- All Figures
- Figures for Mapp et al., 2010
|
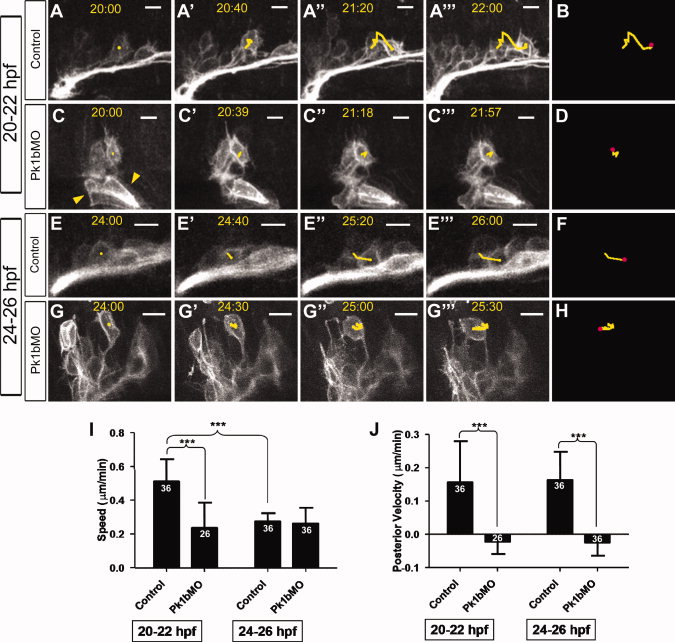
Fig. 2 Pk1b deficiency alters both overall speed and posterior-directed velocity of FBMN migration. A, C, E, G: Frames from time-lapse movies of zCREST1:membRFP embryos, showing movements of FBMNs. A-A: Control, 20-22 hpf. C-C: Pk1b morphant, 20-22 hpf. E-E: Control, 24-26 hpf. G-G: Pk1b morphant, 24-26 hpf. Scale bars = 10 m. Note that there are membRFP-positive cells in otic vesicle (yellow arrowheads). B, D, F, H: Yellow lines represent cumulative movements of cells tracked in A, C, E, and G, respectively. Pink dots correspond to final position of tracked neurons during the course of the time-lapse analysis. I,J: Average FBMN speed (I) and posterior-directed velocity (J) was measured over the course of time-lapse movies. Numbers above each bar indicate the number of cells tracked (n). N = 3 embryos for each class. Scale bars = 10 m. *P < 0.05; **P < 0.01; ***P < 0.001.