
|
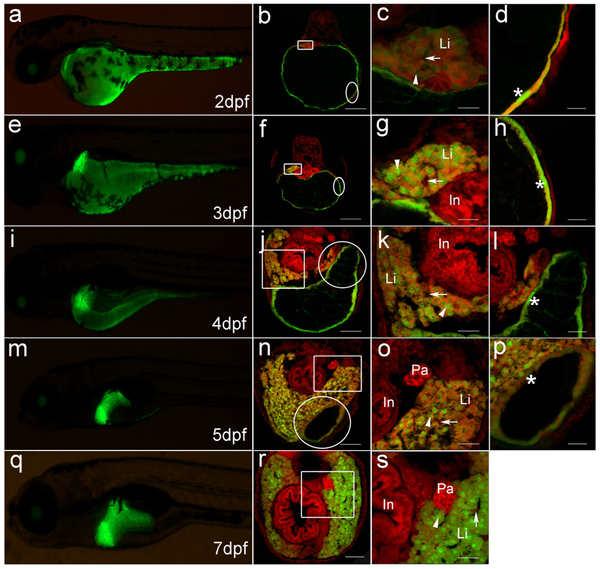
Fig. 5
Dynamic GFP expression pattern in liver morphogenesis of Tg(Apo14: GFP) from 2dpf to 7dpf.
(a, e, i, m, q) show the left lateral view of Tg(Apo14: GFP) larvae from 2dpf to 7dpf. (b, f, j, n, r) show the cross sections through intestine bulb and liver of the larvae at same stage as the left columns. Scale bar: 150 μm. (c, g, k, o, s) are magnifications of the corresponding frame areas in (b, f, j, n, r), which highlight the GFP expression in the hepatocytes. Scale bar: 30 μm. (d, h, l, p) are magnifications of the corresponding circle areas in (b, f, j, n), which highlight the GFP expression on the YSL. Scale bar: 30 μm. Green fluorescence is emitted from the Apo-14 promoter-driven GFP, and red fluorescence is stained by PI for showing the nuclear position. Arrowheads point to hepatocytes, arrows mark sinusoids, and the asterisks delineate the GFP-expressed nuclei on YSL. Li: liver; In: intestine bulb; Pa: pancreas.