
Fig. S1
- ID
- ZDB-IMAGE-110720-54
- Publication
- Simões et al., 2011 - Fgf differentially controls cross-antagonism between cardiac and haemangioblast regulators
- All Figures
- Figures for Simões et al., 2011
|
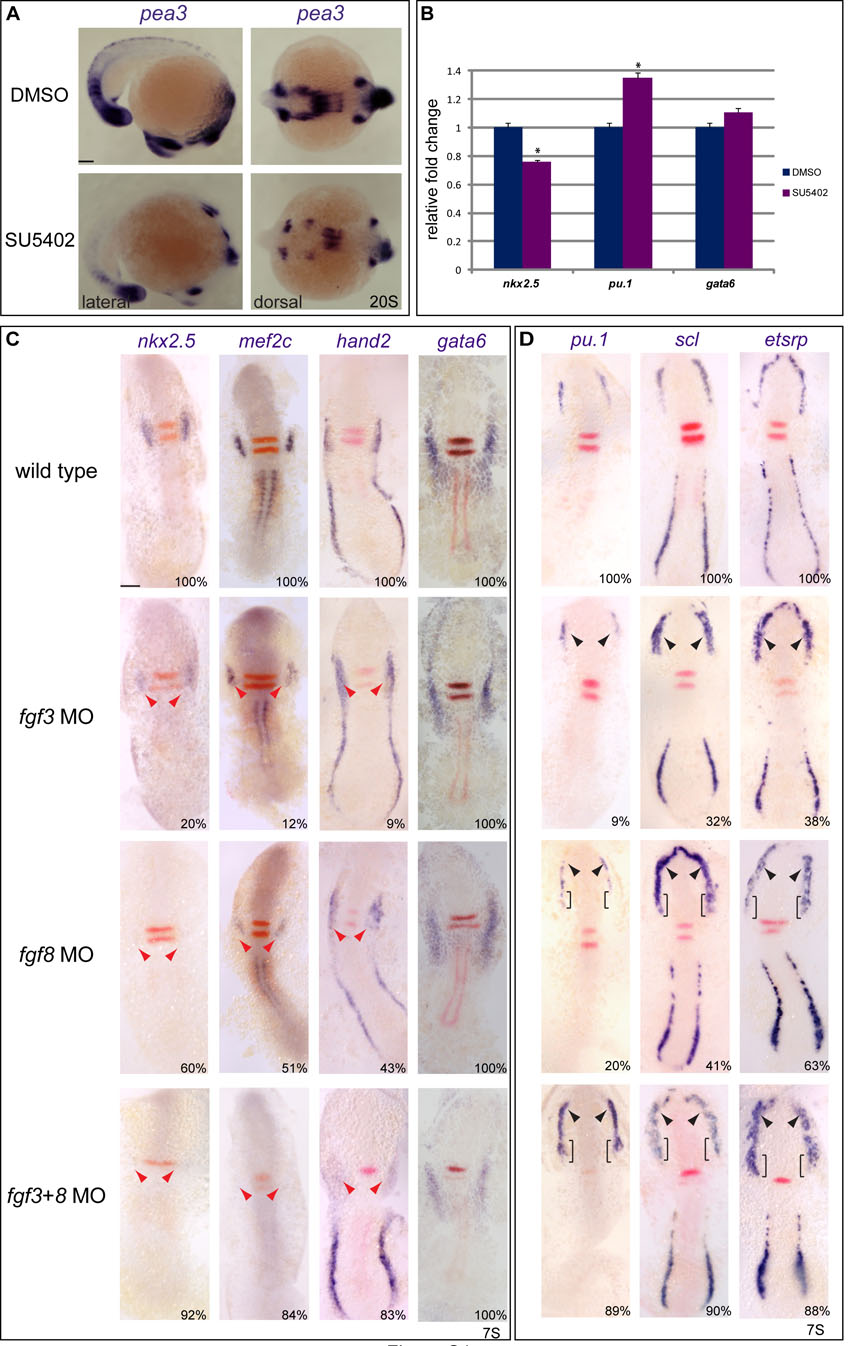
Fig. S1
Fgf inhibition in zebrafish. (A) The Fgf target gene pea3 is downregulated at the 20-somite stage upon treatment with SU5402 from 3 hpf. Dorsal and lateral views rae shown, with anterior to the right and left, respectively. (B) Quantitative PCR on cDNA obtained from RNA extracted from 7-somite embryos treated with DMSO and SU5402, and assayed for nkx2.5, pu.1 and gata6 expression normalized to gapdh. Shown are fold changes in expression relative to the DMSO control, from one representative experiment. Three biological replicates were analysed, each time in triplicate. Error bars indicate s.e.m., asterisks indicate statistically significant differences (P<0.05) compared with DMSO controls. (C,D) fgf3 and fgf8 combine to specify heart versus haemangioblast cell identity. Cardiac (C) and blood/endothelial (D) gene expression effects at the 7-somite stage, when fgf3 and fgf8 were knocked down individually (fgf3 MO, fgf8 MO) or in combination (fgf3+8 MO) are shown. Percentage of embryos with downregulation of cardiac markers (red arrowheads) or upregulation (black arrowheads) plus or minus expansion (brackets) of anterior haemangioblast gene expression are shown. Embryos are flat mounted, anterior to the top. krox20 (red) acted as a positional marker and revealed the loss of rhombomere 5 expression when both fgf3+8 expression was inhibited. Scale bars: 100 μm.