
Fig. S3
- ID
- ZDB-IMAGE-110720-40
- Publication
- Liu et al., 2011 - A variant of fibroblast growth factor receptor 2 (fgfr2) regulates left-right asymmetry in zebrafish
- All Figures
- Figures for Liu et al., 2011
|
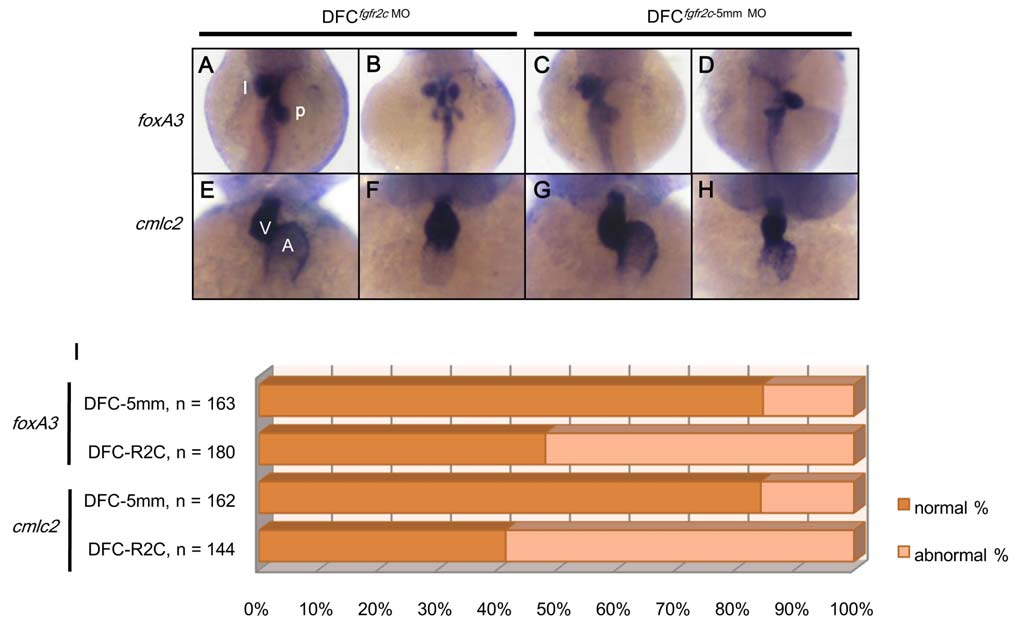
Fig. S3
The effects of fgfr2c MO specific on DFCs. The normal expression pattern of foxA3 in liver (l) and pancreas (p) was shown in DFCfgfr2c MO and DFCfgfr2c-5 mm MO morphants (A and C). Abnormal pattern of visceral organs was also observed in these embryos (B and D). The development of heart was examined using cmlc2 probe (E~H). Normal (E and G) and abnormal heart looping (F and H) can be observed in both morphants. The bar charts showed the percentage of embryos with different expression distribution of foxA3 or cmlc2 in both morphants (I). Panel A to D were dorsal view and panel E to H were ventral-anterior view. A: atrium, V: ventricle.