
|
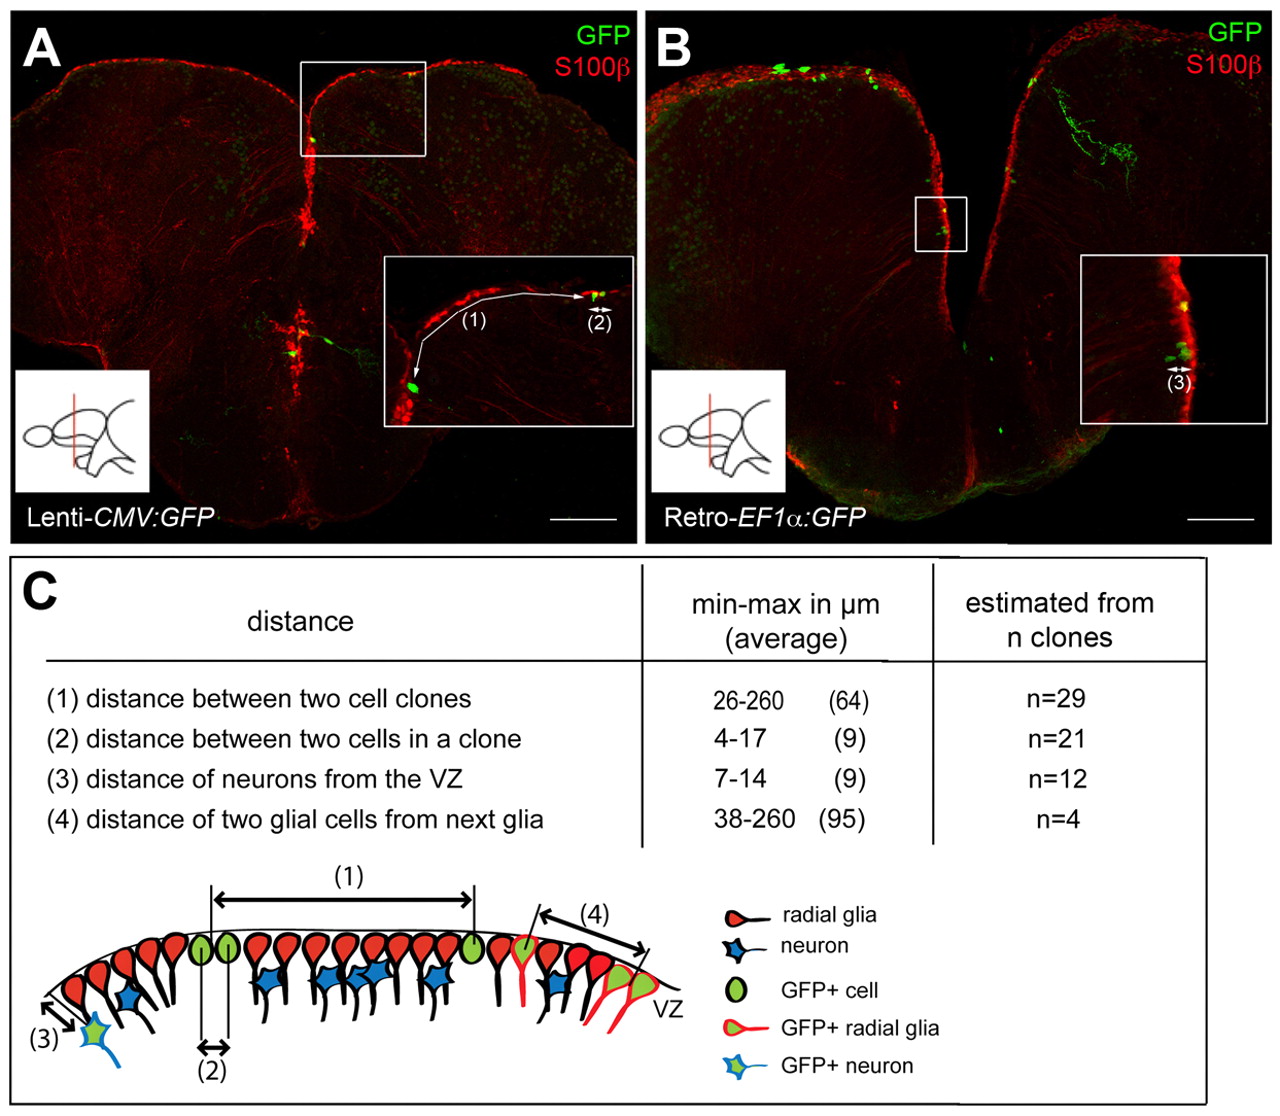
Fig. 4
Conditions used for clonal analyses. (A,B) Composite z-stack images of typical slices analyzed, showing the density of single cells and cell clones per slice, revealed in a double immunocytochemistry for GFP (green) and S100β (red). Insets show magnified views of the boxed areas, numbers in brackets refer to the distances described in C. Scale bars: 100 μm. (C) Distance separating clones and cells within a clone at 28 dpi. We considered as a single clone cells that were adjacent (distance between cell centers reached a maximum of 17 μm in one case with two very elongated cells), and separated from the next cell (group) by at least 25 μm. n, number of clones counted from a minimum of four sections from four brains for each distance.