
IMAGE
Fig. S2
- ID
- ZDB-IMAGE-110622-94
- Publication
- Yang et al., 2011 - BMP and non-canonical Wnt signaling are required for inhibition of secondary tail formation in zebrafish
- All Figures
- Figures for Yang et al., 2011
Image
|
Figure Caption
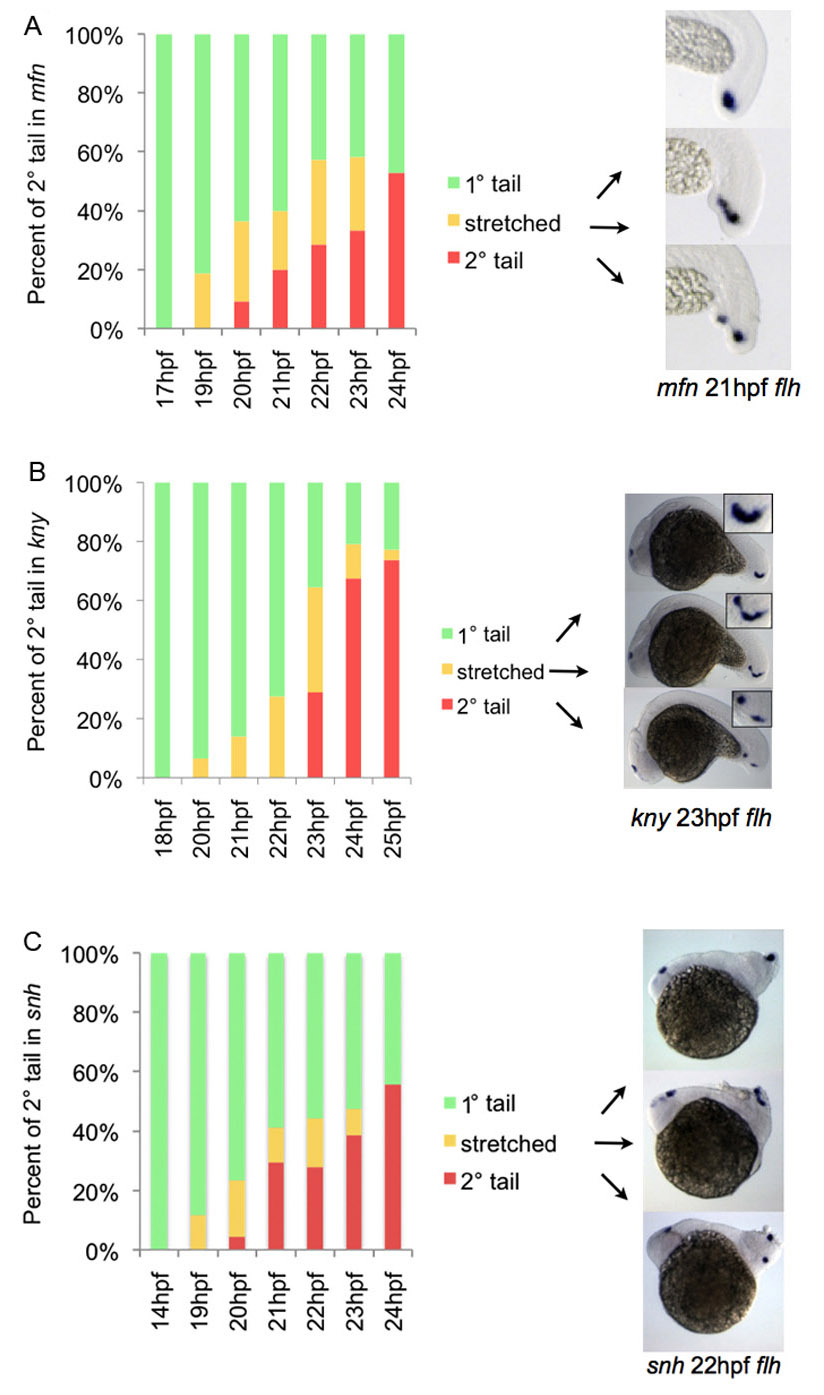
Fig. S2
Distribution of morphological phenotypes of flh-expressing CNHs in mfn, kny and snh embryos fixed at the indicated time points. Right panel shows the lateral view of representative embryo in each phenotypic class. For each time point around 40 embryos were scored.
Acknowledgments
This image is the copyrighted work of the attributed author or publisher, and
ZFIN has permission only to display this image to its users.
Additional permissions should be obtained from the applicable author or publisher of the image.
Full text @ Development