
Fig. s6
- ID
- ZDB-IMAGE-110622-84
- Publication
- Fish et al., 2011 - A Slit/miR-218/Robo regulatory loop is required during heart tube formation in zebrafish
- All Figures
- Figures for Fish et al., 2011
|
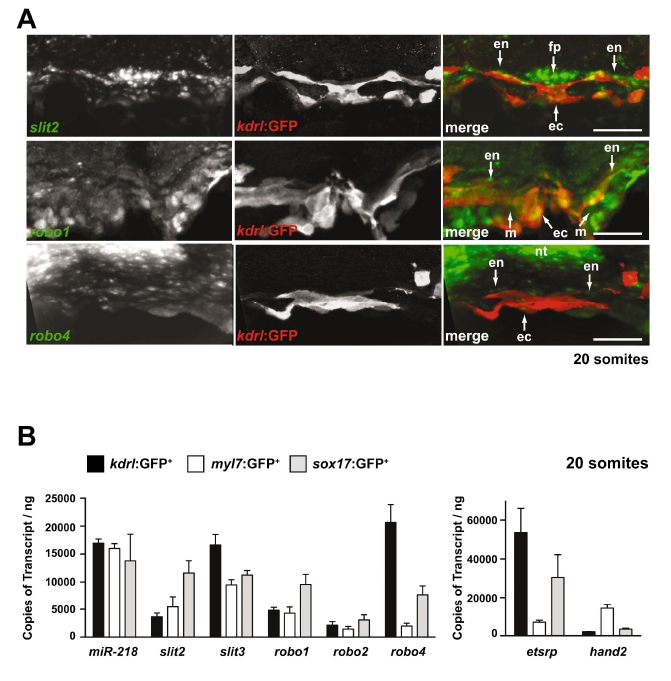
Fig. s6
Expression of Slit/Robo components during heart field migration. (A) Expression of slit2, robo1 and robo4 was determined by fluorescent in situ hybridization of 20-somite stage embryos. Shown are transverse sections, dorsal to the top. slit2, robo1 or robo4 are indicated in green in the merged images, whereas Tg(kdrl:GFP), which marks the endocardium, is indicated in red in the merged images. slit2 appears to be expressed in the floor plate of the neural tube, in the endoderm and also in the endocardium. robo1 appears to be expressed in the endoderm, myocardium and the endocardium, whereas robo4 appears to be expressed in the dorsal neural tube and at low levels in the endocardium. fp, floor plate; ec, endocardium; en, endoderm; nt, neural tube; m, myocardium. Scale bar: 50 μm. (B) Expression profile of miR-218, slit2, slit3, robo1, robo2 and robo4 in sorted cells from the indicated transgenic zebrafish lines at 18-20 somites. kdrl:GFP labels the endothelial/endocardium, myl7:GFP labels the myocytes and sox17:GFP labels the endoderm. etsrp (etv2) and hand2 were used as positive controls of endothelial/endocardial and myocardial lineages, respectively. The mean ± s.e.m. of three independent experiments is shown.