
|
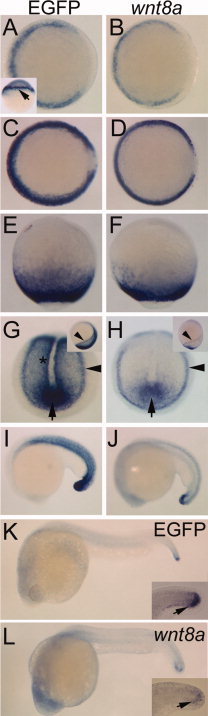
Fig. 3
Transcription profile of Tg(wnt8aPAC:EGFP) compared to wnt8a. A,C,E,G,I,K: In situ hybridization for EGFP transcripts. B,D,F,H,J,L: In situ hybridizations for wnt8a transcripts. A,B: Forty percent epiboly, animal pole view, dorsal right. Both the transgene and wnt8a are expressed in the ventrolateral margin and are excluded from the dorsal margin. Inset in A: Lateral view of EGFP expression at dome-30% epiboly to illustrate YSL expression (arrow). C,D: Shield stage, animal pole view, dorsal right. Note continued expression in the ventrolateral margin and exclusion from the organizer. E,F: Ninety percent epiboly, lateral view, dorsal right. Note expression of EGFP and wnt8a in the embryonic margin. EGFP transcripts are detected in a broader band at the margin, likely reflecting a longer transcript half-life. G,H: Late bud stage, posterior view. Note strong expression of EGFP and wnt8a in the tailbud (arrows) and prospective pronephros (arrowheads, also in inset). EGFP transcripts are also detected in the paraxial mesoderm and adaxial cells (asterisk). Insets: Lateral views, anterior up. I,J: Eighteen-somite stage, lateral view, anterior left. EGFP transcripts are detected strongly in the tailbud, similar to wnt8a. EGFP transcripts continue to be detected in paraxial mesoderm. K,L: 24 hpf, lateral view, anterior left. EGFP transcripts are detected only at the tip of the tail (K) similar to wnt8a (L). Insets: Higher magnification of the tail. wnt8a is expressed at barely detectable levels at the tip of the tail (arrows).